


Welcome to part 3 in my 7-part series on Machine Learning and Data Science. Be sure to check out the other parts in the series, as they all lead into each other.
- Part 1: A 6-Step Framework To Tackle Machine Learning Projects (Full Pipeline)
- Part 2: Introduction to NumPy
- Part 3: Introduction to Pandas + Python (Which is what you're reading right now)
- Part 4: Beginners Guide To Matplotlib (With Code Examples)
- Part 5: Introduction to Scikit-Learn
- Part 6: Introduction to Deep Learning with TensorFlow
- Part 7: Communicating & Sharing Your Work as a Machine Learning Engineer / Data Scientist
In this tutorial, we will be focusing on data analysis and manipulation with python and pandas, along with code examples.
However, because the pandas library is so vast, there are often so many ways to do the same thing. That’s why we’ll be covering some of the most fundamental functions of the library, so that you get a broader understanding.
More specifically, we'll look at:
- Importing and exporting data
- Describing data
- Viewing and selecting data, and finally
- Manipulating data with pandas and python
After going through this, you'll have a basic knowledge of data manipulation with pandas, so that you can then use it in your own projects and work.
Sidenote: The topics in this post can be a little difficult to comprehend - especially if you’re just starting out.
If you want to deep dive into python and pandas, and learn Machine Learning from scratch or simply to up your current skills, then check out my complete Machine Learning and Data Science course, or watch the first few videos for free.

It’s one of the most popular, highly rated Machine Learning and Data Science bootcamps online, as well as the most modern and up-to-date. Guaranteed.
You'll go from a complete beginner with no prior experience to getting hired as a Machine Learning Engineer this year, so it’s helpful for ML Engineers of all experience levels.
Want a sample of the course? Well check out the video below!:
Why listen to me?
My name is Daniel Bourke, and I'm the resident Machine Learning instructor here at Zero To Mastery.
Originally self-taught, I worked for one of Australia's fastest-growing artificial intelligence agencies, Max Kelsen, and have worked on Machine Learning and data problems across a wide range of industries including healthcare, eCommerce, finance, retail, and more.
I'm also the author of Machine Learning Monthly, write my own blog on my experiments in ML, and run my own YouTube channel - which has hit over 7.8 Million views.
Phew!
With all that out of the way, let’s get back into this tutorial, and start at the beginning.
What is pandas?
pandas is an open-source library that helps you analyze and manipulate data.

Why care?
Simply put, if you're getting into Machine Learning and Data Science, and you're using python, then you're going to be using pandas (and probably NumPy).
According to a survey by Jetbrains in 2021 and 2022, around 55% of data analysts use pandas with python, and that number continues to rise.

So what makes it so popular?
Why pandas?
pandas provides a simple-to-use but very capable set of functions that you can use on your data.
It's also integrated with many other Data Science and Machine Learning tools that use Python, so having an understanding of it will be incredibly helpful throughout your journey.
For example
One of the main use cases you'll come across is using pandas to transform your data in a way that makes it usable with Machine Learning algorithms, but more on that in a second.
Pandas key features
We'll be going through a few of these throughout the post, but here's some quick notes on each of the main pandas features:
- DataFrame: The DataFrame is a two-dimensional table-like data structure with rows and columns. It's the primary data structure used in pandas and is built on top of NumPy arrays. You'll see a few of these throughout this tutorial
- Series: A one-dimensional labeled array capable of holding any data type. Basically a single column of a DataFrame
- Indexing and Selection: This allows us to select or index data from dataframes, so that we can work on that data
- Data Cleaning: Nothing worse than processing bloat or inaccurate information. Pandas offers numerous functions for cleaning, preprocessing, and handling missing values
- Grouping and Aggregation: Pandas supports the grouping of data based on one or more criteria, and the application of various aggregate functions (sum, mean, count, etc.) to the grouped data. We'll go through some Boolean examples later on
- Merging and Joining: Pandas provides functionality to merge or join DataFrames based on common columns or indices. This is useful for combining datasets
- Time Series Data: Need to analyze data based on specific times? Pandas has robust support for time series data, including date range generation, resampling, and frequency conversion
- Input/Output Tools: Pandas can read and write data from/to various file formats, including CSV, Excel, SQL databases, and more. It's incredibly easy to use
- Statistical and Mathematical Operations: Pandas supports various statistical and mathematical operations on data, such as mean, median, standard deviation, correlation, and more
- Plotting: Pandas integrates with Matplotlib for easy and customizable data visualization, making it convenient to create a wide range of plots directly from DataFrames
- Handling Categorical Data: Pandas provides tools for working with categorical data, allowing for efficient storage and analysis of data with a limited, fixed set of values
- Multi-level Indexing: DataFrames can have hierarchically indexed rows and columns, enabling more complex data structures
- Memory Efficiency: Pandas is designed for memory efficiency and supports out-of-core computation for working with datasets that are larger than the available RAM
- Broadcasting: Pandas supports broadcasting, allowing for efficient element-wise operations on arrays of different shapes and sizes
So yeah. Quite a few benefits and features!
1. Importing pandas
To get started using pandas, the first step is to import it using the abbreviation pd.
Sidenote: If you see the letters
pdused anywhere in Machine Learning or Data Science, then it's probably referring to the pandas library.
Input:
import pandas as pd

# Print the version
print(f"pandas version: {pd.__version__}")
Output:
pandas version: 1.5.22. Understanding pandas datatypes
pandas has two main datatypes, Series and DataFrame:
pandas.Seriesis a 1-dimensional column of data, whilepandas.DataFrame(most common) is a 2-dimensional table of data with rows and columns
You can create a Series using pd.Series() and passing it a Python list.
For example
Input:
# Creating a series of car types
cars = pd.Series(["BMW", "Toyota", "Honda"])
cars
Output:
0    BMW
1    Toyota
2    Honda
dtype: object
Input:
# Creating a series of colours
colours = pd.Series(["Blue", "Red", "White"])
colours
Output:
0    Blue
1    Red
2    White
dtype: object
You can also create a DataFrame by using pd.DataFrame() and passing it a Python dictionary.
For example
Let's use our two Series as the values.
Input:
# Creating a DataFrame of cars and colours
car_data = pd.DataFrame({"Car type": cars,
                         "Colour": colours})
car_data
Output:

It's important to note though that many different types of data could go into the DataFrame. Here we've used only text but you could use floats, integers, dates, and more.
3. Importing data
Being able to create Series and DataFrame's from scratch is nice, but what you'll usually be doing is importing your data in the form of a .csv (comma separated value file), a spreadsheet file, or something similar such as a SQL database.
Good news is that pandas allows for easy importing of data like this through functions such as pd.read_csv() and pd.read_excel() for Microsoft Excel files.
For example...
Importing from a Google sheet to a pandas dataframe
Let's say that you wanted to get the information from this Google Sheet document into a pandas DataFrame.

You could export it as a .csv file and then import it using pd.read_csv().
In this case, the exported .csv file is called car-sales.csv.
Input:
# Import car sales data
car_sales = pd.read_csv("../data/car-sales.csv") # takes a filename as string as input
car_sales
Output:

Boom! Now we've got the same data from the spreadsheet, but available in a pandas DataFrame called car_sales, which means we can take advantage of all of pandas functionality on it.
Sidenote: Another common practice that you'll see, is data being imported to DataFrame being referred to as 'df', which of course, is short for DataFrame.
For example
Input:
# Import the car sales data and save it to df
df = pd.read_csv("../data/car-sales.csv")
df
Output:

Now car_sales and df contain the exact same information, the only difference is the name. Just like with any other variable, you can name your DataFrame's whatever you want, but it's always best to choose something simple.
The anatomy of a DataFrame
Different functions use different labels for different things, and can get a little confusing.
However, this graphic sums up some of the main components of DataFrame's and their different names.

4. Exporting data
OK, so after you've made a few changes to your data, you might want to export it and save it so someone else can access the changes.
pandas allows you to export DataFrame's to .csv format using .to_csv(), or to a spreadsheet format using .to_excel().
For example...
Exporting a dataframe to a CSV
We haven't made any changes yet to the car_sales DataFrame but let's try to export it.
# Export the car sales DataFrame to csv
car_sales.to_csv("../data/exported-car-sales.csv")
Running this will save a file called export-car-sales.csv to the current folder.

5. Describing data
One of the first things you'll want to do after you import some data into a pandas DataFrame is to start exploring it.
The good news is that pandas has many built-in functions which allow you to quickly get information about a DataFrame.
For example
Let's explore our car_sales DataFrame again, and then try some functions out on it.
Input:
car_salesOutput:
Use .dtypes to find what datatype a column contains
.dtypes show us what datatype each column contains.
For example
Input:
car_sales.dtypesOutput
Make             object
Colour           object
Odometer (KM)     int64
Doors             int64
Price            object
dtype: object
Notice how the Price column isn't an integer like Odometer or Doors? Don't worry, pandas makes this easy to fix.
Use .describe() for a statistical overview
.describe() gives you a quick statistical overview of the numerical columns, like so:
Input:
car_sales.describe()Output:

Use .info() to find information about a dataframe
.info() shows a handful of useful information about a DataFrame such as:
- How many entries (rows) there are
- Whether there are missing values (if a columns non-null value is less than the number of entries, it has missing values)
- The datatypes of each column
Input:
car_sales.info()Output:
<class 'pandas.core.frame.DataFrame'>
RangeIndex: 10 entries, 0 to 9
Data columns (total 5 columns):
 #   Column         Non-Null Count  Dtype
---  ------         --------------  -----
 0   Make           10 non-null     object
 1   Colour         10 non-null     object
 2   Odometer (KM)  10 non-null     int64
 3   Doors          10 non-null     int64
 4   Price          10 non-null     object
dtypes: int64(2), object(3)
memory usage: 528.0+ bytes
Using mathematical methods on a dataframe
You can also call various statistical and mathematical methods such as .mean() or .sum() directly onto a DataFrame or Series.
Using .mean() on a dataframe
Input:
# Calling .mean() on a DataFrame
car_sales.mean(numeric_only=True) # numeric_only = get mean values of numeric columns only
Output:
Odometer (KM)    78601.4
Doors                4.0
dtype: float64
Using .mean() on a series
Input:
# Calling .mean() on a Series
car_prices = pd.Series([3000, 3500, 11250])
car_prices.mean()
Output:
5916.666666666667Using .sum() on a dataframe (true and false)
Input:
# Calling .sum() on a DataFrame with numeric_only=False (default)
car_sales.sum(numeric_only=False)
Output:
Make             ToyotaHondaToyotaBMWNissanToyotaHondaHondaToyo...
Colour               WhiteRedBlueBlackWhiteGreenBlueBlueWhiteWhite
Odometer (KM)                                               786014
Doors                                                           40
Price            $4,000.00$5,000.00$7,000.00$22,000.00$3,500.00...
dtype: object
Input:
# Calling .sum() on a DataFrame with numeric_only=True
car_sales.sum(numeric_only=True)
Output:
Odometer (KM)    786014
Doors                40
dtype: int64
Using .sum() on a series
Input:
# Calling .sum() on a Series
car_prices.sum()
Output:
17750Using .columns on a dataframe
Calling on a whole DataFrame may not be as helpful as targeting an individual column, but it's helpful to know they're there.
For example
.columns will show you all the columns of a DataFrame.
Input:
car_sales.columnsOutput:
Index(['Make', 'Colour', 'Odometer (KM)', 'Doors', 'Price'], dtype='object')How to save .columns to a list
You can also save them to a list that you can use later.
Input:
# Save car_sales columns to a list
car_columns = car_sales.columns
car_columns[0]
Output:
'Make'Use .index to find the values in a dataframes index
.index will show you the values in a DataFrame's index (the column on the far left).
Input:
car_sales.indexOutput:
RangeIndex(start=0, stop=10, step=1)Important: pandas
DataFrame's, just like Python lists, are 0-indexed (unless otherwise changed). This means they start at 0.

Input:
# Show the length of a DataFrame
len(car_sales)
Output:
10This means that because the length of our car_sales dataframe is 10, the indexes go from 0-9. (10 characters total).
6. Viewing and selecting data
Some common methods for viewing and selecting data in a pandas DataFrame include:
DataFrame.head(n=5)- Displays the firstnrows of a DataFrame (e.g.car_sales.head()will show the first 5 rows of thecar_salesDataFrame)DataFrame.tail(n=5)- Displays the lastnrows of a DataFrameDataFrame.loc[]- Accesses a group of rows and columns by labels or a boolean arrayDataFrame.iloc[]- Accesses a group of rows and columns by integer indices (e.g.car_sales.iloc[0]shows all the columns from index0DataFrame.columns- Lists the column labels of the DataFrameDataFrame['A']- Selects the column named'A'from the DataFrameDataFrame[DataFrame['A'] > 5]- Boolean indexing filters rows based on column values meeting a condition (e.g. all rows from column'A'greater than5DataFrame.plot()- Creates a line plot of a DataFrame's columns (e.g. plotMakevs.Odometer (KM)columns withcar_sales[["Make", "Odometer (KM)"]].plot();)DataFrame.hist()- Generates histograms for columns in a DataFramepandas.crosstab()- Computes a cross-tabulation of two or more factors
In practice, you'll constantly be making changes to your data, and viewing it.
The thing is, you probably won't always want to change all of the data in your DataFrame's either.
The good news is that there are just as many different ways to select data as there are to view it!
Use .head() to view the first 5 rows of a dataframe
For example
.head() allows you to view the first 5 rows of your DataFrame.
Input:
# Show the first 5 rows of car_sales
car_sales.head()
Output:

Use .head() with an integer, to view as many rows as you want
Want more than 5 rows? No worries! You can pass .head() an integer to display more than or less than 5 rows.
For example
Input:
# Show the first 7 rows of car_sales
car_sales.head(7)
Output:

Simple!
We can adjust that integer to any number we want, to show that many rows.
Use .tail() to see the bottom 5 rows
.tail() allows you to see the bottom 5 rows of your DataFrame. This is helpful if your changes are influencing the bottom rows of your data, and you want to quickly inspect those rows.
Input:
# Show bottom 5 rows of car_sales
car_sales.tail()
Output:

Use .loc[] and .iloc[] to select data from a dataframe
You can use .loc[] and .iloc[] to select data from your Series and DataFrame's.
For example
Input:
# Create a sample series
animals = pd.Series(["cat", "dog", "bird", "snake", "ox", "lion"],
                    index=[0, 3, 9, 8, 67, 3])
animals
Output:
0       cat
3       dog
9      bird
8     snake
67       ox
3      lion
dtype: object
.loc[] takes an integer or label as input, and it chooses from your Series or DataFrame. (Whichever index matches the number).
For example
Input:
# Select all indexes with 3
animals.loc[3]
Output:
3     dog
3    lion
dtype: object
Input:
# Select index 9
animals.loc[9]
Output:
'bird'For example
Let's try this with our car_sales DataFrame again, so we can see how it affects it.
Input:
car_salesOutput:
Input:
# Select row at index 3
car_sales.loc[3]
Output:
Make                    BMW
Colour                Black
Odometer (KM)         11179
Doors                     5
Price            $22,000.00
Name: 3, dtype: object
iloc[] does a similar thing but works with exact positions.
Input:
animalsOutput:
0       cat
3       dog
9      bird
8     snake
67       ox
3      lion
dtype: object
Input:
# Select row at position 3
animals.iloc[3]
Output:
'snake'Even though snake appears at index 8 in the series, it's shown using .iloc[3] because it's at the 3rd (starting from 0) position.
For example
Let's try with the car_sales DataFrame.
Input:
# Select row at position 3
car_sales.iloc[3]
Output:
Make                    BMW
Colour                Black
Odometer (KM)         11179
Doors                     5
Price            $22,000.00
Name: 3,
dtype: object
You can see it's the same as .loc[] because the index is in order, position 3 is the same as index 3.
Slicing with .loc[] and .iloc[]
You can also use slicing with .loc[] and .iloc[].
Input:
# Get all rows up to position 3
animals.iloc[:3]
Output:
0     cat
3     dog
9    bird
dtype: object
Input:
# Get all rows up to (and including) index 3
car_sales.loc[:3]
Output:

Input:
# Get all rows of the "Colour" column
car_sales.loc[:, "Colour"] # note: ":" stands for "all", e.g. "all indices in the first axis"
Output:
0    White
1      Red
2     Blue
3    Black
4    White
5    Green
6     Blue
7     Blue
8    White
9    White
Name: Colour, dtype: object
When should you use .loc[] or .iloc[]?
- Use
.loc[]when you're selecting rows and columns based on their labels or a condition (e.g. retrieving data for specific columns) - Use
.iloc[]when you're selecting rows and columns based on their integer index positions (e.g. extracting the first ten rows regardless of the labels)
However, in saying this, it will often take a bit of practice with each of the methods before you figure out which you'd like to use.
For example...
Column selection with DataFrame.['COLUMN_NAME']
If you want to select a particular column, you can use DataFrame.['COLUMN_NAME'].
Input:
# Select Make column
car_sales['Make']
Output:
0    Toyota
1     Honda
2    Toyota
3       BMW
4    Nissan
5    Toyota
6     Honda
7     Honda
8    Toyota
9    Nissan
Name: Make, dtype: object
Input:
# Select Colour column
car_sales['Colour']
Output:
0    White
1      Red
2     Blue
3    Black
4    White
5    Green
6     Blue
7     Blue
8    White
9    White
Name: Colour, dtype: object
Boolean indexing for column selection
Boolean indexing works with column selection too, and using it will select the rows which fulfill the condition in the brackets.
Input:
# Select cars with over 100,000 on the Odometer
car_sales[car_sales["Odometer (KM)"] > 100000]
Output:
| Make | Colour | Odometer (KM) | Doors | Price | |
| 0 | Toyota | White | 150043 | 4 | $4,000.00 |
| 4 | Nissan | White | 213095 | 4 | $3,500.00 |
Input:
# Select cars which are made by Toyota
car_sales[car_sales["Make"] == "Toyota"]
Output:
| Make | Colour | Odometer (KM) | Doors | Price | |
| 0 | Toyota | White | 150043 | 4 | $4,000.00 |
| 2 | Toyota | Blue | 32549 | 3 | $7,000.00 |
| 5 | Toyota | Green | 99213 | 4 | $4,500.00 |
| 8 | Toyota | White | 60000 | 4 | $6,250.00 |
Use pd.crosstab() to view and compare different columns
pd.crosstab() is a great way to view two different columns together and compare them.
Input:
# Compare car Make with number of Doors
pd.crosstab(car_sales["Make"], car_sales["Doors"])
Output:
| Doors | 3 | 4 | 5 |
| Make | |||
| BMW | 0 | 0 | 1 |
| Honda | 0 | 3 | 0 |
| Nissan | 0 | 2 | 0 |
| Toyota | 1 | 3 | 0 |
Use .groupby() to contextually compare columns
If you want to compare more columns in the context of another column, you can use .groupby().
Input:
car_salesOutput:
| Make | Colour | Odometer (KM) | Doors | Price | |
| 0 | Toyota | White | 150043 | 4 | $4,000.00 |
| 1 | Honda | Red | 87899 | 4 | $5,000.00 |
| 2 | Toyota | Blue | 32549 | 3 | $7,000.00 |
| 3 | BMW | Black | 11179 | 5 | $22,000.00 |
| 4 | Nissan | White | 213095 | 4 | $3,500.00 |
| 5 | Toyota | Green | 99213 | 4 | $4,500.00 |
| 6 | Honda | Blue | 45698 | 4 | $7,500.00 |
| 7 | Honda | Blue | 54738 | 4 | $7,000.00 |
| 8 | Toyota | White | 60000 | 4 | $6,250.00 |
| 9 | Nissan | White | 31600 | 4 | $9,700.00 |
Input:
# Group by the Make column and find the mean of the other columns
car_sales.groupby(["Make"]).mean(numeric_only=True)
Output:

Use matplotlib to visualize data in columns
pandas even allows for quick plotting of columns so you can see your data visually, as long as you import matplotlib.
Important: If your plots aren't showing, try running the two lines of code below:
%matplotlib inlineis a special command which tells Jupyter to show your plots- Commands with
%at the front are called magic commands.
For example
Input:
# Import matplotlib and tell Jupyter to show plots
import matplotlib.pyplot as plt
%matplotlib inline
You can visualize a column by calling .plot() on it.
Input:
car_sales["Odometer (KM)"].plot(); # tip: the ";" on the end prevents matplotlib from outputting the plot class
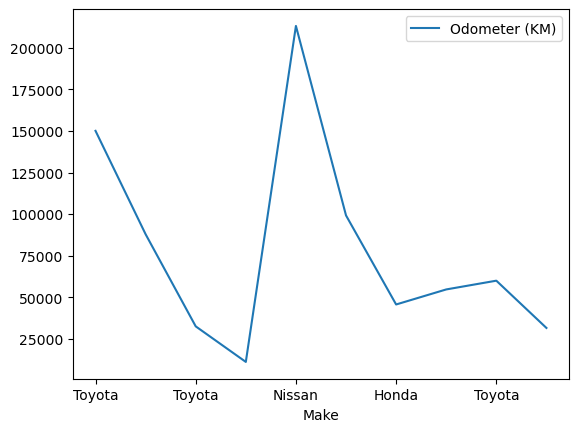
Compare columns with x, y, and plot()
You can compare two columns by passing them as x and y to plot().
For example
Input:
car_sales.plot(x="Make", y="Odometer (KM)"); Output:
Use .hist()to see the distribution
The distribution of something is a way of describing the spread of different values. You can see the distribution of a column by calling .hist() on you.
car_sales["Odometer (KM)"].hist()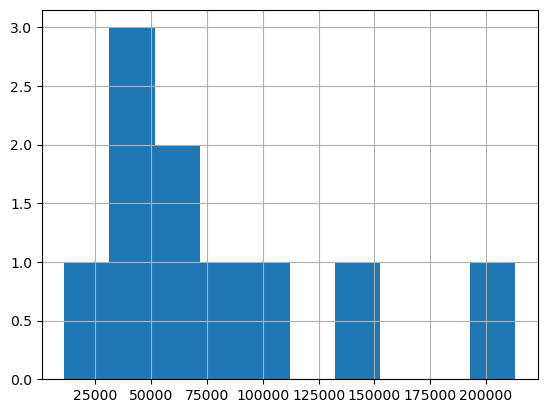
In this case, the majority of the distribution (spread) of the Odometer (KM) column is more towards the left of the graph, and there are two more outliers to the right.
Now what if we wanted to plot our Price column?
Input:
car_sales["Price"].plot()Output:
---------------------------------------------------------------------------
TypeError                                 Traceback (most recent call last)
Cell In[52], line 1
----> 1 car_sales["Price"].plot()

File ~/code/zero-to-mastery-ml/env/lib/python3.8/site-packages/pandas/plotting/_core.py:1000, in PlotAccessor.__call__(self, *args, **kwargs)
    997             label_name = label_kw or data.columns
    998             data.columns = label_name
-> 1000 return plot_backend.plot(data, kind=kind, **kwargs)

File ~/code/zero-to-mastery-ml/env/lib/python3.8/site-packages/pandas/plotting/_matplotlib/__init__.py:71, in plot(data, kind, **kwargs)
     69         kwargs["ax"] = getattr(ax, "left_ax", ax)
     70 plot_obj = PLOT_CLASSES[kind](data, **kwargs)
---> 71 plot_obj.generate()
     72 plot_obj.draw()
     73 return plot_obj.result

File ~/code/zero-to-mastery-ml/env/lib/python3.8/site-packages/pandas/plotting/_matplotlib/core.py:450, in MPLPlot.generate(self)
    448 def generate(self) -> None:
    449     self._args_adjust()
--> 450     self._compute_plot_data()
    451     self._setup_subplots()
    452     self._make_plot()

File ~/code/zero-to-mastery-ml/env/lib/python3.8/site-packages/pandas/plotting/_matplotlib/core.py:635, in MPLPlot._compute_plot_data(self)
    633 # no non-numeric frames or series allowed
    634 if is_empty:
--> 635     raise TypeError("no numeric data to plot")
    637 self.data = numeric_data.apply(self._convert_to_ndarray)

TypeError: no numeric data to plot
Trying to run it leaves us with an error. This is because the Price column of car_sales isn't in numeric form. We can tell this because of the TypeError: no numeric data to plot error at the bottom of the cell.
We can check this with .info().
Input:
car_sales.info()Output:
<class 'pandas.core.frame.DataFrame'>
RangeIndex: 10 entries, 0 to 9
Data columns (total 5 columns):
 #   Column         Non-Null Count  Dtype
---  ------         --------------  -----
 0   Make           10 non-null     object
 1   Colour         10 non-null     object
 2   Odometer (KM)  10 non-null     int64
 3   Doors          10 non-null     int64
 4   Price          10 non-null     object
dtypes: int64(2), object(3)
memory usage: 528.0+ bytes
So what can we do?
We need to convert the Price column to a numeric type.
How? Well, we could try a few different things on our own, but let's practice researching for a solution.
Google solutions
Open up a search engine and type in something like "how to convert a pandas column price to integer".
In the first result, I found this Stack Overflow question and answer . Where someone has had the same problem as us and someone else has provided an answer.
Note: Sometimes the answer you're looking for won't be in the first result, or the 2nd or the 3rd. You may have to combine a few different solutions. Or, if possible, you can try and ask ChatGPT to help you out.
Analyze
Read through the answer and see if it relates to your problem. If it does, you can adjust the code from what's given in the Stack Overflow answer(s) to your own problem.
Search for other solutions
If you're still stuck, you can try and converse with ChatGPT to help you with your problem.
Important! Don't use these tools if you're not allowed to share your data. These tools have full access when uploaded so be careful. Never share private data with anyone on the internet, including AI chatbots.

What's important in the beginning is not to remember every single detail off by heart but to know where to look. Remember, if in doubt, write code, run it, see what happens.
Let's copy the answer code that we found here and see how it relates to our problem.
dataframe['amount'] = dataframe['amount'].str.replace('[\$\,\.]', '').astype(int)
It's not quite perfect. In fact, there's a lot going on here that we don't need, but we can simply change the parts which aren't in our problem and keep the rest the same.
For example
Our DataFrame is called car_sales not dataframe, so let's fix that first.
car_sales['amount'] = car_sales['amount'].str.replace('[\$\,\.]', '').astype(int)
Also, our amount column is called Price, so let's edit that too.
car_sales["Price"] = car_sales["Price"].str.replace('[\$\,\.]', '').astype(int)
That looks better, but there's still more to edit. The code on the right of car_sales["Price"] is saying "remove the $ sign and comma and change the type of the cell to int".
Let's see what happens if we run that.
Input:
# Change Price column to integers
car_sales["Price"] = car_sales["Price"].str.replace('[$\,\.]', '', regex=True)
car_sales
Output:
| Make | Colour | Odometer (KM) | Doors | Price | |
| 0 | Toyota | White | 150043 | 4 | 400000 |
| 1 | Honda | Red | 87899 | 4 | 500000 |
| 2 | Toyota | Blue | 32549 | 3 | 700000 |
| 3 | BMW | Black | 11179 | 5 | 2200000 |
| 4 | Nissan | White | 213095 | 4 | 350000 |
| 5 | Toyota | Green | 99213 | 4 | 450000 |
| 6 | Honda | Blue | 45698 | 4 | 750000 |
| 7 | Honda | Blue | 54738 | 4 | 700000 |
| 8 | Toyota | White | 60000 | 4 | 625000 |
| 9 | Nissan | White | 31600 | 4 | 970000 |
It works, but there are extra zeros in the Price column, so let's fix it.
Input:
# Remove extra zeros from the price column
car_sales["Price"] = car_sales["Price"].str[:-2].astype(int)
Input:
car_sales.dtypesOutput:
Make             object
Colour           object
Odometer (KM)     int64
Doors             int64
Price             int64
dtype: object
Beautiful! Now let's try to plot it again.
Input:
car_sales["Price"].plot();
This is one of the many ways you can manipulate data using pandas.

When you see a number of different functions in a row, it's referred to as chaining. This means you add together a series of functions all to do one overall task.
Let's see a few more ways of manipulating data.
7. Manipulating data
Because pandas is based on Python, whatever way you can manipulate strings in Python, you can do the same in pandas.
Manipulating data in pandas with string methods
You can access the string value of a column using .str. So, knowing this, how do you think you'd set a column to lowercase?
Input:
# Lower the Make column
car_sales["Make"].str.lower()
Output:
0    toyota
1     honda
2    toyota
3       bmw
4    nissan
5    toyota
6     honda
7     honda
8    toyota
9    nissan
Name: Make, dtype: object
Notice how it doesn't change the values of the original car_sales DataFrame unless we set it equal to.
Input:
# View top 5 rows, Make column not lowered
car_sales.head()
Output:
| Make | Colour | Odometer (KM) | Doors | Price | |
| 0 | Toyota | White | 150043 | 4 | 4000 |
| 1 | Honda | Red | 87899 | 4 | 5000 |
| 2 | Toyota | Blue | 32549 | 3 | 7000 |
| 3 | BMW | Black | 11179 | 5 | 22000 |
| 4 | Nissan | White | 213095 | 4 | 3500 |
Input:
# Set Make column to be lowered
car_sales["Make"] = car_sales["Make"].str.lower()
car_sales.head()
Output:
| Make | Colour | Odometer (KM) | Doors | Price | |
| 0 | toyota | White | 150043 | 4 | 4000 |
| 1 | honda | Red | 87899 | 4 | 5000 |
| 2 | toyota | Blue | 32549 | 3 | 7000 |
| 3 | bmw | Black | 11179 | 5 | 22000 |
| 4 | nissan | White | 213095 | 4 | 3500 |
Reassigning the column changes it in the original DataFrame. (This trend occurs throughout all kinds of data manipulation with pandas).
Some functions have a parameter called inplace which means a DataFrame is updated in place without having to reassign it.
Use .fillna() to fill missing data
Let's see what it looks like in combination with .fillna(), a function which fills missing data.
Although we're not missing any data. in practice, it's likely you'll work with datasets which aren't complete. What this means is you'll have to decide whether to fill the missing data or remove the rows which have data missing.
Let's check out what a version of our car_sales DataFrame might look like with missing values.
Input:
# Import car sales data with missing values
car_sales_missing = pd.read_csv("../data/car-sales-missing-data.csv")
car_sales_missing
Output:
| Make | Colour | Odometer | Doors | Price | |
| 0 | Toyota | White | 150043.0 | 4.0 | $4,000 |
| 1 | Honda | Red | 87899.0 | 4.0 | $5,000 |
| 2 | Toyota | Blue | NaN | 3.0 | $7,000 |
| 3 | BMW | Black | 11179.0 | 5.0 | $22,000 |
| 4 | Nissan | White | 213095.0 | 4.0 | $3,500 |
| 5 | Toyota | Green | NaN | 4.0 | $4,500 |
| 6 | Honda | NaN | NaN | 4.0 | $7,500 |
| 7 | Honda | Blue | NaN | 4.0 | NaN |
| 8 | Toyota | White | 60000.0 | NaN | NaN |
| 9 | NaN | White | 31600.0 | 4.0 | $9,700 |
Missing values are shown by NaN in pandas, and can be considered the equivalent of None in Python.
Let's use the .fillna() function to fill the Odometer column with the average of the other values in the same column.
(We'll do it with and without inplace).
Input:
# Fill Odometer column missing values with mean
car_sales_missing["Odometer"].fillna(car_sales_missing["Odometer"].mean(),
                                     inplace=False) # inplace is set to False by default
Output:
0    150043.000000
1     87899.000000
2     92302.666667
3     11179.000000
4    213095.000000
5     92302.666667
6     92302.666667
7     92302.666667
8     60000.000000
9     31600.000000
Name: Odometer, dtype: float64
Now let's check the original car_sales_missing DataFrame.
Input:
car_sales_missingOutput:
| Make | Colour | Odometer | Doors | Price | |
| 0 | Toyota | White | 150043.0 | 4.0 | $4,000 |
| 1 | Honda | Red | 87899.0 | 4.0 | $5,000 |
| 2 | Toyota | Blue | NaN | 3.0 | $7,000 |
| 3 | BMW | Black | 11179.0 | 5.0 | $22,000 |
| 4 | Nissan | White | 213095.0 | 4.0 | $3,500 |
| 5 | Toyota | Green | NaN | 4.0 | $4,500 |
| 6 | Honda | NaN | NaN | 4.0 | $7,500 |
| 7 | Honda | Blue | NaN | 4.0 | NaN |
| 8 | Toyota | White | 60000.0 | NaN | NaN |
| 9 | NaN | White | 31600.0 | 4.0 | $9,700 |
Because inplace is set to False (default), there's still missing values in the Odometer column, so let's try setting inplace to True.
Input:
# Fill the Odometer missing values to the mean with inplace=True
car_sales_missing["Odometer"].fillna(car_sales_missing["Odometer"].mean(),
                                     inplace=True)
Let's check again:
Input:
car_sales_missingOutput:
| Make | Colour | Odometer | Doors | Price | |
| 0 | Toyota | White | 150043.000000 | 4.0 | $4,000 |
| 1 | Honda | Red | 87899.000000 | 4.0 | $5,000 |
| 2 | Toyota | Blue | 92302.666667 | 3.0 | $7,000 |
| 3 | BMW | Black | 11179.000000 | 5.0 | $22,000 |
| 4 | Nissan | White | 213095.000000 | 4.0 | $3,500 |
| 5 | Toyota | Green | 92302.666667 | 4.0 | $4,500 |
| 6 | Honda | NaN | 92302.666667 | 4.0 | $7,500 |
| 7 | Honda | Blue | 92302.666667 | 4.0 | NaN |
| 8 | Toyota | White | 60000.000000 | NaN | NaN |
| 9 | NaN | White | 31600.000000 | 4.0 | $9,700 |
The missing values in the Odometer column have been filled with the mean value of the same column.
In practice, you might not want to fill a column's missing values with the mean, but this was an example to simply show the difference between
inplace=False(default) andinplace=True.
Whichever you choose to use will depend on how you structure your code. All you have to remember is inplace=False returns a copy of the DataFrame you're working with.
This is helpful if you want to make a duplicate of your current DataFrame and save it to another variable. Whereas, inplace=True makes all the changes directly to the target DataFrame.
We've filled in some values but there's still missing values in car_sales_missing.
Use .dropna() if you want to remove rows with missing data
If you want to remove any rows that had missing data and only work with rows which had complete coverage, you can do this using .dropna().
Input:
# Remove missing data
car_sales_missing.dropna()
Output:
| Make | Colour | Odometer | Doors | Price | |
| 0 | Toyota | White | 150043.000000 | 4.0 | $4,000 |
| 1 | Honda | Red | 87899.000000 | 4.0 | $5,000 |
| 2 | Toyota | Blue | 92302.666667 | 3.0 | $7,000 |
| 3 | BMW | Black | 11179.000000 | 5.0 | $22,000 |
| 4 | Nissan | White | 213095.000000 | 4.0 | $3,500 |
| 5 | Toyota | Green | 92302.666667 | 4.0 | $4,500 |
It appears the rows with missing values have been removed, now let's check to make sure:
Input:
car_sales_missingOutput:
| Make | Colour | Odometer | Doors | Price | |
| 0 | Toyota | White | 150043.000000 | 4.0 | $4,000 |
| 1 | Honda | Red | 87899.000000 | 4.0 | $5,000 |
| 2 | Toyota | Blue | 92302.666667 | 3.0 | $7,000 |
| 3 | BMW | Black | 11179.000000 | 5.0 | $22,000 |
| 4 | Nissan | White | 213095.000000 | 4.0 | $3,500 |
| 5 | Toyota | Green | 92302.666667 | 4.0 | $4,500 |
| 6 | Honda | NaN | 92302.666667 | 4.0 | $7,500 |
| 7 | Honda | Blue | 92302.666667 | 4.0 | NaN |
| 8 | Toyota | White | 60000.000000 | NaN | NaN |
| 9 | NaN | White | 31600.000000 | 4.0 | $9,700 |
They're still there because .dropna() has inplace=False as default.
To fix this, we can either set inplace=True or reassign the car_sales_missing DataFrame.
For example
Input:
# The following two lines do the same thing
car_sales_missing.dropna(inplace=True) # Operation happens inplace without reassignment
car_sales_missing = car_sales_missing.dropna() # car_sales_missing gets reassigned to same DataFrame but with dropped values
Now if I check again, the rows with missing values are gone and the index numbers have been updated.
Input:
car_sales_missingOutput:
| Make | Colour | Odometer | Doors | Price | |
| 0 | Toyota | White | 150043.000000 | 4.0 | $4,000 |
| 1 | Honda | Red | 87899.000000 | 4.0 | $5,000 |
| 2 | Toyota | Blue | 92302.666667 | 3.0 | $7,000 |
| 3 | BMW | Black | 11179.000000 | 5.0 | $22,000 |
| 4 | Nissan | White | 213095.000000 | 4.0 | $3,500 |
| 5 | Toyota | Green | 92302.666667 | 4.0 | $4,500 |
Instead of removing or filling data, what if you wanted to create it?
pandas allows for simple extra column creation on DataFrame's.
Three common ways are:
- Adding a
pandas.Seriesas an additional column - Adding a Python list as a column, or
- By using existing columns to create a new column
For example
Creating a column called Seats for the number of seats.
Input:
# Create a column from a pandas Series
seats_column = pd.Series([5, 5, 5, 5, 5, 5, 5, 5, 5, 5])
car_sales["Seats"] = seats_column
car_sales
Output:
| Make | Colour | Odometer (KM) | Doors | Price | Seats | |
| 0 | toyota | White | 150043 | 4 | 4000 | 5 |
| 1 | honda | Red | 87899 | 4 | 5000 | 5 |
| 2 | toyota | Blue | 32549 | 3 | 7000 | 5 |
| 3 | bmw | Black | 11179 | 5 | 22000 | 5 |
| 4 | nissan | White | 213095 | 4 | 3500 | 5 |
| 5 | toyota | Green | 99213 | 4 | 4500 | 5 |
| 6 | honda | Blue | 45698 | 4 | 7500 | 5 |
| 7 | honda | Blue | 54738 | 4 | 7000 | 5 |
| 8 | toyota | White | 60000 | 4 | 6250 | 5 |
| 9 | nissan | White | 31600 | 4 | 9700 | 5 |
Creating a column is similar to selecting a column. You pass the target DataFrame along with a new column name in brackets.
Input:
# Create a column from a Python list
engine_sizes = [1.3, 2.0, 3.0, 4.2, 1.6, 1, 2.0, 2.3, 2.0, 3.0]
car_sales["Engine Size"] = engine_sizes
car_sales
Output:
| Make | Colour | Odometer (KM) | Doors | Price | Seats | Engine Size | |
| 0 | toyota | White | 150043 | 4 | 4000 | 5 | 1.3 |
| 1 | honda | Red | 87899 | 4 | 5000 | 5 | 2.0 |
| 2 | toyota | Blue | 32549 | 3 | 7000 | 5 | 3.0 |
| 3 | bmw | Black | 11179 | 5 | 22000 | 5 | 4.2 |
| 4 | nissan | White | 213095 | 4 | 3500 | 5 | 1.6 |
| 5 | toyota | Green | 99213 | 4 | 4500 | 5 | 1.0 |
| 6 | honda | Blue | 45698 | 4 | 7500 | 5 | 2.0 |
| 7 | honda | Blue | 54738 | 4 | 7000 | 5 | 2.3 |
| 8 | toyota | White | 60000 | 4 | 6250 | 5 | 2.0 |
| 9 | nissan | White | 31600 | 4 | 9700 | 5 | 3.0 |
You can also make a column by directly combining the values of other columns, such as, price per kilometre on the Odometer.
Input:
# Column from other columns
car_sales["Price per KM"] = car_sales["Price"] / car_sales["Odometer (KM)"]
car_sales
Output:
| Make | Colour | Odometer (KM) | Doors | Price | Seats | Engine Size | Price per KM | |
| 0 | toyota | White | 150043 | 4 | 4000 | 5 | 1.3 | 0.026659 |
| 1 | honda | Red | 87899 | 4 | 5000 | 5 | 2.0 | 0.056883 |
| 2 | toyota | Blue | 32549 | 3 | 7000 | 5 | 3.0 | 0.215060 |
| 3 | bmw | Black | 11179 | 5 | 22000 | 5 | 4.2 | 1.967976 |
| 4 | nissan | White | 213095 | 4 | 3500 | 5 | 1.6 | 0.016425 |
| 5 | toyota | Green | 99213 | 4 | 4500 | 5 | 1.0 | 0.045357 |
| 6 | honda | Blue | 45698 | 4 | 7500 | 5 | 2.0 | 0.164121 |
| 7 | honda | Blue | 54738 | 4 | 7000 | 5 | 2.3 | 0.127882 |
| 8 | toyota | White | 60000 | 4 | 6250 | 5 | 2.0 | 0.104167 |
| 9 | nissan | White | 31600 | 4 | 9700 | 5 | 3.0 | 0.306962 |
Now can you think why this might not be a great column to add?
It could be confusing when a car with less kilometers on the odometer looks to cost more per kilometre than one with more. When buying a car, usually less kilometres on the odometer is better.
This kind of column creation is called feature engineering, the practice of enriching your dataset with more information (either from it directly or elsewhere).
If Make, Colour, and Doors are features of the data, creating Price per KM could be another. But in this case, not a very good one.
As for column creation, you can also create a new column setting all values to a one standard value.
Input:
# Column to all 1 value (number of wheels)
car_sales["Number of wheels"] = 4
car_sales
Output:
| Make | Colour | Odometer (KM) | Doors | Price | Seats | Engine Size | Price per KM | Number of wheels | |
| 0 | toyota | White | 150043 | 4 | 4000 | 5 | 1.3 | 0.026659 | 4 |
| 1 | honda | Red | 87899 | 4 | 5000 | 5 | 2.0 | 0.056883 | 4 |
| 2 | toyota | Blue | 32549 | 3 | 7000 | 5 | 3.0 | 0.215060 | 4 |
| 3 | bmw | Black | 11179 | 5 | 22000 | 5 | 4.2 | 1.967976 | 4 |
| 4 | nissan | White | 213095 | 4 | 3500 | 5 | 1.6 | 0.016425 | 4 |
| 5 | toyota | Green | 99213 | 4 | 4500 | 5 | 1.0 | 0.045357 | 4 |
| 6 | honda | Blue | 45698 | 4 | 7500 | 5 | 2.0 | 0.164121 | 4 |
| 7 | honda | Blue | 54738 | 4 | 7000 | 5 | 2.3 | 0.127882 | 4 |
| 8 | toyota | White | 60000 | 4 | 6250 | 5 | 2.0 | 0.104167 | 4 |
| 9 | nissan | White | 31600 | 4 | 9700 | 5 | 3.0 | 0.306962 | 4 |
Input:
car_sales["Passed road safety"] = True
car_sales
Output:
| Make | Colour | Odometer (KM) | Doors | Price | Seats | Engine Size | Price per KM | Number of wheels | Passed road safety | |
| 0 | toyota | White | 150043 | 4 | 4000 | 5 | 1.3 | 0.026659 | 4 | True |
| 1 | honda | Red | 87899 | 4 | 5000 | 5 | 2.0 | 0.056883 | 4 | True |
| 2 | toyota | Blue | 32549 | 3 | 7000 | 5 | 3.0 | 0.215060 | 4 | True |
| 3 | bmw | Black | 11179 | 5 | 22000 | 5 | 4.2 | 1.967976 | 4 | True |
| 4 | nissan | White | 213095 | 4 | 3500 | 5 | 1.6 | 0.016425 | 4 | True |
| 5 | toyota | Green | 99213 | 4 | 4500 | 5 | 1.0 | 0.045357 | 4 | True |
| 6 | honda | Blue | 45698 | 4 | 7500 | 5 | 2.0 | 0.164121 | 4 | True |
| 7 | honda | Blue | 54738 | 4 | 7000 | 5 | 2.3 | 0.127882 | 4 | True |
| 8 | toyota | White | 60000 | 4 | 6250 | 5 | 2.0 | 0.104167 | 4 | True |
| 9 | nissan | White | 31600 | 4 | 9700 | 5 | 3.0 | 0.306962 | 4 | True |
Removing columns
You can remove a column using .drop('COLUMN_NAME', axis=1), like so:.
Input:
# Drop the Price per KM column
car_sales = car_sales.drop("Price per KM", axis=1) # columns live on axis 1
car_sales
Output:
| Make | Colour | Odometer (KM) | Doors | Price | Seats | Engine Size | Number of wheels | Passed road safety | |
| 0 | toyota | White | 150043 | 4 | 4000 | 5 | 1.3 | 4 | True |
| 1 | honda | Red | 87899 | 4 | 5000 | 5 | 2.0 | 4 | True |
| 2 | toyota | Blue | 32549 | 3 | 7000 | 5 | 3.0 | 4 | True |
| 3 | bmw | Black | 11179 | 5 | 22000 | 5 | 4.2 | 4 | True |
| 4 | nissan | White | 213095 | 4 | 3500 | 5 | 1.6 | 4 | True |
| 5 | toyota | Green | 99213 | 4 | 4500 | 5 | 1.0 | 4 | True |
| 6 | honda | Blue | 45698 | 4 | 7500 | 5 | 2.0 | 4 | True |
| 7 | honda | Blue | 54738 | 4 | 7000 | 5 | 2.3 | 4 | True |
| 8 | toyota | White | 60000 | 4 | 6250 | 5 | 2.0 | 4 | True |
| 9 | nissan | White | 31600 | 4 | 9700 | 5 | 3.0 | 4 | True |
Why axis=1? Simply because that's where the axis columns live on, while rows live on axis=0.
For example
Let's say you wanted to shuffle the order of your DataFrame so you could split it into training, validation and test sets - even though the order of your samples was random.
To do so you could use .sample(frac=1). (.sample() randomly samples different rows from a DataFrame).
The frac parameter dictates the fraction, where 1 = 100% of rows, 0.5 = 50% of rows, 0.01 = 1% of rows. You can also use .sample(n=1) where n is the number of rows to sample.
Input:
# Sample car_sales
car_sales_sampled = car_sales.sample(frac=1)
car_sales_sampled
Output:
| Make | Colour | Odometer (KM) | Doors | Price | Seats | Engine Size | Number of wheels | Passed road safety | |
| 4 | nissan | White | 213095 | 4 | 3500 | 5 | 1.6 | 4 | True |
| 6 | honda | Blue | 45698 | 4 | 7500 | 5 | 2.0 | 4 | True |
| 3 | bmw | Black | 11179 | 5 | 22000 | 5 | 4.2 | 4 | True |
| 5 | toyota | Green | 99213 | 4 | 4500 | 5 | 1.0 | 4 | True |
| 1 | honda | Red | 87899 | 4 | 5000 | 5 | 2.0 | 4 | True |
| 9 | nissan | White | 31600 | 4 | 9700 | 5 | 3.0 | 4 | True |
| 8 | toyota | White | 60000 | 4 | 6250 | 5 | 2.0 | 4 | True |
| 7 | honda | Blue | 54738 | 4 | 7000 | 5 | 2.3 | 4 | True |
| 2 | toyota | Blue | 32549 | 3 | 7000 | 5 | 3.0 | 4 | True |
| 0 | toyota | White | 150043 | 4 | 4000 | 5 | 1.3 | 4 | True |
Notice how the rows remain intact but their order is mixed (check the indexes).
.sample(frac=X) is also helpful when you're working with a large DataFrame.
For example
Say you had 2,000,000 rows.
Running tests, analysis and machine learning algorithms on 2,000,000 rows could take a long time. And since being a data scientist or machine learning engineer is about reducing the time between experiments, you might begin with a sample of rows first.
You could use 40k_rows = 2_mil_rows.sample(frac=0.05) to work on 40,000 rows from a DataFrame called 2_mil_rows containing 2,000,000 rows.
What if you wanted to get the indexes back in order?
You could do so using .reset_index().
Input:
# Reset the indexes of car_sales_sampled
car_sales_sampled.reset_index()
Output:
| index | Make | Colour | Odometer (KM) | Doors | Price | Seats | Engine Size | Number of wheels | Passed road safety | |
| 0 | 4 | nissan | White | 213095 | 4 | 3500 | 5 | 1.6 | 4 | True |
| 1 | 6 | honda | Blue | 45698 | 4 | 7500 | 5 | 2.0 | 4 | True |
| 2 | 3 | bmw | Black | 11179 | 5 | 22000 | 5 | 4.2 | 4 | True |
| 3 | 5 | toyota | Green | 99213 | 4 | 4500 | 5 | 1.0 | 4 | True |
| 4 | 1 | honda | Red | 87899 | 4 | 5000 | 5 | 2.0 | 4 | True |
| 5 | 9 | nissan | White | 31600 | 4 | 9700 | 5 | 3.0 | 4 | True |
| 6 | 8 | toyota | White | 60000 | 4 | 6250 | 5 | 2.0 | 4 | True |
| 7 | 7 | honda | Blue | 54738 | 4 | 7000 | 5 | 2.3 | 4 | True |
| 8 | 2 | toyota | Blue | 32549 | 3 | 7000 | 5 | 3.0 | 4 | True |
| 9 | 0 | toyota | White | 150043 | 4 | 4000 | 5 | 1.3 | 4 | True |
Calling .reset_index() on a DataFrame resets the index numbers to their defaults. It also creates a new Index column by default which contains the previous index values.
Applying functions to a column
Finally, what if you wanted to apply a function to a column. Such as, converting the Odometer column from kilometers to miles.
You can do so using the .apply() function and passing it a Python lambda function.
We know there's about 1.6 kilometers in a mile, so if you divide the value in the Odometer column by 1.6, it should convert it to miles, like so:
Input:
# Change the Odometer values from kilometres to miles
car_sales["Odometer (KM)"].apply(lambda x: x / 1.6)
Output:
0     93776.875
1     54936.875
2     20343.125
3      6986.875
4    133184.375
5     62008.125
6     28561.250
7     34211.250
8     37500.000
9     19750.000
Name: Odometer (KM), dtype: float64
Now let's check our car_sales DataFrame to see if it worked.
Input:
car_salesOutput:
| Make | Colour | Odometer (KM) | Doors | Price | Seats | Engine Size | Number of wheels | Passed road safety | |
| 0 | toyota | White | 150043 | 4 | 4000 | 5 | 1.3 | 4 | True |
| 1 | honda | Red | 87899 | 4 | 5000 | 5 | 2.0 | 4 | True |
| 2 | toyota | Blue | 32549 | 3 | 7000 | 5 | 3.0 | 4 | True |
| 3 | bmw | Black | 11179 | 5 | 22000 | 5 | 4.2 | 4 | True |
| 4 | nissan | White | 213095 | 4 | 3500 | 5 | 1.6 | 4 | True |
| 5 | toyota | Green | 99213 | 4 | 4500 | 5 | 1.0 | 4 | True |
| 6 | honda | Blue | 45698 | 4 | 7500 | 5 | 2.0 | 4 | True |
| 7 | honda | Blue | 54738 | 4 | 7000 | 5 | 2.3 | 4 | True |
| 8 | toyota | White | 60000 | 4 | 6250 | 5 | 2.0 | 4 | True |
| 9 | nissan | White | 31600 | 4 | 9700 | 5 | 3.0 | 4 | True |
The Odometer column didn't change because we didn't reassign it.
Input:
# Reassign the Odometer column to be miles instead of kilometers
car_sales["Odometer (KM)"] = car_sales["Odometer (KM)"].apply(lambda x: x / 1.6)
car_sales
Output:
| Make | Colour | Odometer (KM) | Doors | Price | Seats | Engine Size | Number of wheels | Passed road safety | |
| 0 | toyota | White | 93776.875 | 4 | 4000 | 5 | 1.3 | 4 | True |
| 1 | honda | Red | 54936.875 | 4 | 5000 | 5 | 2.0 | 4 | True |
| 2 | toyota | Blue | 20343.125 | 3 | 7000 | 5 | 3.0 | 4 | True |
| 3 | bmw | Black | 6986.875 | 5 | 22000 | 5 | 4.2 | 4 | True |
| 4 | nissan | White | 133184.375 | 4 | 3500 | 5 | 1.6 | 4 | True |
| 5 | toyota | Green | 62008.125 | 4 | 4500 | 5 | 1.0 | 4 | True |
| 6 | honda | Blue | 28561.250 | 4 | 7500 | 5 | 2.0 | 4 | True |
| 7 | honda | Blue | 34211.250 | 4 | 7000 | 5 | 2.3 | 4 | True |
| 8 | toyota | White | 37500.000 | 4 | 6250 | 5 | 2.0 | 4 | True |
| 9 | nissan | White | 19750.000 | 4 | 9700 | 5 | 3.0 | 4 | True |
How will you use pandas with your own data analysis and manipulation?
Phew! That was a lot!
If you can believe it, we're still only scratching the surface of what you can do with pandas for Data Science and Machine Learning.
So if you're excited about diving deeper into this, then check out my complete Machine Learning and Data Science course, or watch the first few videos for free.
Better still? You can ask me and other students questions right in our private Discord channel, so you'll never be stuck!


