


Picture the scene - you’ve been given a task to assess company data from your boss.
You add it all to Excel and start manipulating the information to find some insights, and let’s be honest, it takes a little while to run but it works and does a great job.
Your boss loves this and wants you to assess more information, but you’re starting to hit a few roadblocks.
Issue #1:
Standard Excel worksheets are ‘technically’ limited to around a million rows of data. I say technically because unless you have a powerful machine with a lot of memory, you’re going to get hardware constraints, further limiting how many rows you can handle.
This means you might not be able assess the data that your boss has asked you to look at 😢.
Issue #2:
It takes its time to process, and you end up having to wait even longer.
But let's be honest, it's unlikely you're going to get that many rows without excel crashing.
You can’t get a new or upgraded machine, and so you start looking for other solutions.

You play around with Excel some more, and start to learn about Excel’s built-in ETL tool (Extract, Transform, Load) called Power Query.

Power Query is a powerful tool in its own right, but the thing is, Excel's business intelligence tools actually go far, far beyond simply being able to extract and transform external data sources.
What is the Excel Data Model?
In addition to just dropping these datasets into worksheet tabs, we can also add them to what's known as the Excel Data Model, which is truly the cornerstone of Excel's business intelligence capabilities.
Why?
Because Excel's Data Model doesn't suffer from any of these previous constraints!
- It’s an efficient engine for storing and compressing data
- It allows you to analyze datasets of potentially hundreds of millions of rows, right from your desktop
- And even more importantly, it allows us to build Pivot Tables, or 'Power' Pivot Tables that provide analytics from multiple separate datasets in a single place. No more creating a different Pivot Table for every different data source you have!
That's what we're going to look at today, so let's dive in...
How to use the Excel Data Model
To help you understand how to use this tool and some of its features, let's work through a hypothetical example.
Let's imagine that I have two CSV (comma-separated values) files, both containing data pertaining to a fictional online surf shop - a place where people can buy surfing supplies or just things you'd want to take to the beach, online.
'Order Details.csv' contains, you guessed it, details about customer orders:

The other file, 'Products.csv', contains information specific to the products the business sells:

Now the first step is going to be simply pulling this data into Excel, so we can work with it using Excel's business intelligence tools.
We'll start with the Order Details file, which contains a row of data for every line item in every customer order. So if one particular customer order had five different products in it, the Order Details file is going to have five rows for that order.
To import that file into Excel, we’ll use Power Query which we mentioned before.
So in a blank Excel file, on the Data tab of the Ribbon I’ll hit 'Get Data' >> 'From File' >> 'From Text/CSV:'

And now I'll simply select navigate to my Order Details file, and click “Import”:

Doing this brings up another dialog box, with a “Load” button that seems like the obvious next step, but not quite!
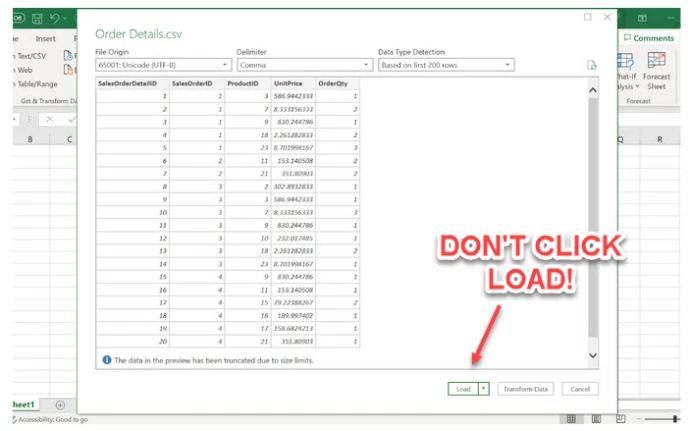
Don't click load!
Why? Well, because our overarching example is focused on the Excel Data Model, we're not going to load the data into an Excel worksheet.
Instead, we'll load it to the Excel Data Model exclusively. To do this, I'll click the down arrow immediately to the right of the Load button, then choose 'Load To':

This brings up yet another dialog box which that will allow me to specify exactly where and how this dataset is to be loaded:

Important: Because we’re going to be analyzing the data in a Pivot Table, we don't need it to be dropped into a table in an Excel worksheet, where it will just take up space.
Rather, I’ll simply create a 'connection' to that dataset, and then add it to the Data Model:
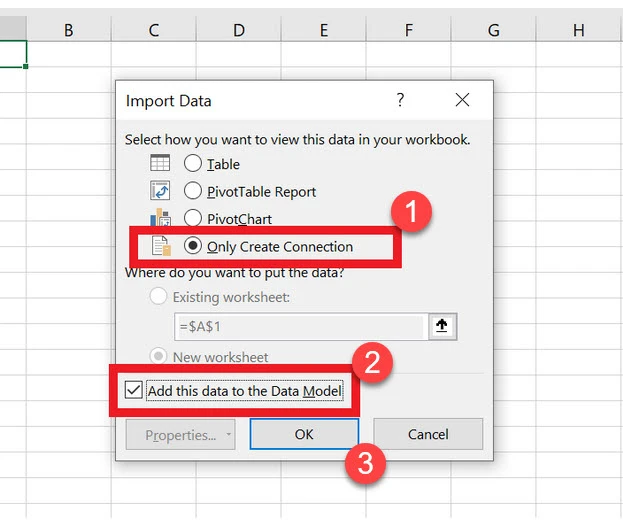
Then after clicking OK, we can see on the “Queries and Connections” pane that the dataset has loaded:

Huzzah!
Next, I’ll check back over on the Data Model just to confirm that the data has loaded there. To do that, I'll click the 'Power Pivot' tab on the Ribbon, and then the 'Manage' button on that tab...

And now I have confirmation that the data has been landed in the Data Model:

Now that's all fine and good, but the real point of the Data Model is the ability to create Pivot Tables that synthesize large amounts of data from multiple sources, in a single place.
So let's take the first step in that direction by creating a Pivot Table from our lone table in the Data Model. You can actually do this directly from the Data Model by hitting this 'Pivot Table' button:

Rather than do this here, I want to show you how to create a Pivot Table with data in the Data Model, from the comfort of a regular old Excel worksheet. That way you can get used to this in a tool that you already have some experience with.
So I'll close out of the Data Model and close the 'Queries and Connections' pane to make some room, and then hit the down arrow under the 'Pivot Table' button on the 'Insert' tab of the ribbon:

This produces a list of three options for the type of data that we can source a Pivot Table from:
- one is a table or range in the worksheet
- one is an external data source
- and the third is the workbook’s Data Model
The latter is obviously what we want, so I’ll click that.

When I click on that, it then brings up another dialog box, prompting me to select where the Pivot Table should be located within the workbook. I’ll select cell B4 of the current worksheet, then click OK.
And that brings up the Field List for the new Pivot Table, which is pretty much the same as any other Pivot Table field list:

But we see that because I had already added the Order Details table to the Data Model, it appears in the field list by default, without me needing to explicitly select it in some way.
And if I click the little arrow next to the table, the area under it expands, displaying a list of all the fields in that table available for us to select:

For the purpose of this example, I'll drag ProductID to the Rows area of the Pivot Table, then I'll drag OrderQty (order quantity) down to the Values area to be summed.

Pretty good so far, but the problem with this view is that we only have the IDs for the various products in the Order Details table, and there's nothing more descriptive, such as a product name, within this dataset.
But that kind of product-specific data is contained in another dataset - the 'Products.csv' file. So what we need is a way to combine the data in the products dataset with our Order Details table dataset, in a single Pivot Table, and that's where relationships come in.
Adding relationships in the Excel Data Model
Relationships allow us to tie different tables together based on fields they have in common, so we can use fields from both tables in one Pivot Table.
This works kind of like a VLOOKUP function - that classic Excel staple - but the big difference is that the source data is kept separate, not mashed together in a single giant table. In fact, it's only in the Pivot Table where data is combined in a unified view.
Now there’s a lot more rationale for keeping datasets in the Data Model separate than I’ll get into here, but one immediate advantage is that we don't even need to take that extra step of combining the two datasets together!

Our Pivot Table can treat multiple tables as a combined dataset, even if they're distinct entities in the Data Model; it all comes down to the relationships we use to connect those tables.
Pretty awesome right?
So to make this Pivot Table summary more meaningful, let’s start by pulling in more information about products, so we can put something besides these ugly product IDs in the Rows area.
The first step in that process, of course, will be to import the 'Products.csv' file and load it to the Data Model. This will involve the exact same steps we followed to import 'Order Details.csv', so I’ll skip the step-by-step walkthrough and resume immediately after the file has been successfully imported:

So now, with the Products dataset loaded, I'll again hit the 'Manage' button on the Power Pivot tab of the Ribbon to see the updated Data Model.
And sure enough, in the 'Data' view of the Data Model, you can see that the Products dataset has been added as a new tab, much like a worksheet in a standard Excel workbook.

But where things get much more interesting, is if we switch to 'Diagram' view in the Power Pivot window:

Now we see these graphical representations of the Order Details and Products tables, side by side.
As things currently stand, we still can't use both of these datasets (at least meaningfully) in a single Pivot Table. But that can be changed with a single step. All we have to do is create a relationship between these datasets.
Looking at the fields listed for each table, we see there is a product ID in both. Now if these tables were just worksheets in an Excel workbook, and you were trying to VLOOKUP your products data into your order details data, you would use product ID as your lookup value.
Similarly, if you were performing a Merge operation in Power Query, product ID would be the key you used to link these two datasets. So naturally, that's how we're going to form a relationship between these two tables in the Diagram View of the Data Model.
And doing this is super easy; it's literally a drag and drop process.
I'll select the ProductID field in the Products table, then click and hold down my mouse button to simply drag over to the ProductID field in the Order Details table.
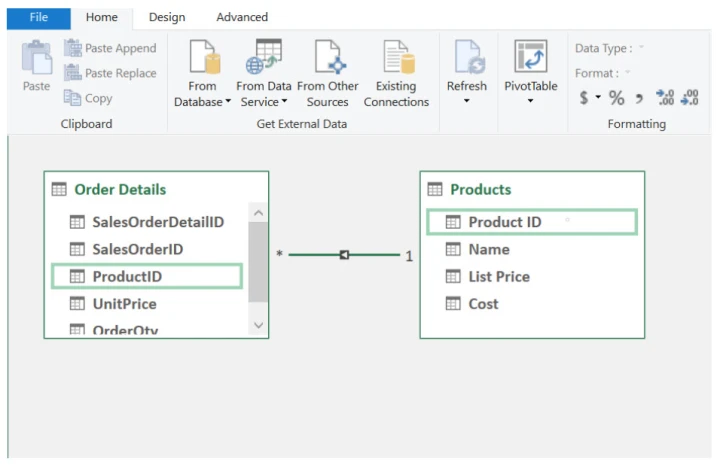
And just like that, the Data Model has generated a relationship between those two tables on product ID!
You may notice that the line that connects these two tables has a '1' on one side, and an asterisk on the other. This means there is a one-to-many relationship between the tables (one product can be associated with many customer order line items), which Excel detected from the data and applied automatically.
Now I should note here that the rabbit hole of table relationships (and data modeling in general) goes pretty deep, and there are entire books written on the subject! But in relatively simple examples like this, Excel makes the process accessible and intuitive to anyone with some level of facility for working with data.
So the practical upshot of this newly formed relationship is that our two tables are connected in such a way that we can use them both in the same Pivot Table.
To (finally) do that, I’ll first close out of the Data Model, and then head back to our Pivot Table. I’ll then click the 'Pivot Table Analyze' contextual tab that appears in the Ribbon whenever we've selected anything inside of a Pivot Table.
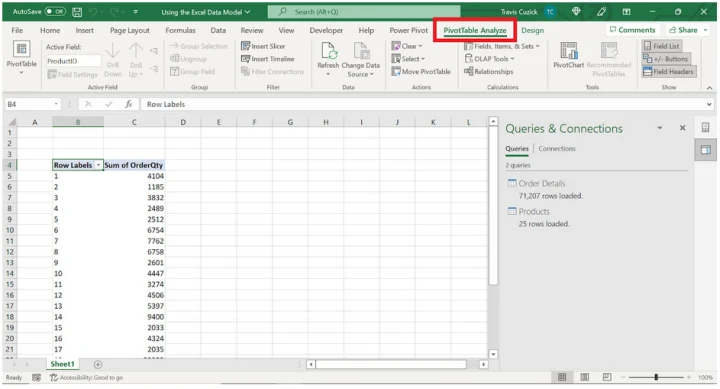
Then to make room for the Pivot Table field list, I'll close out of the “Queries and Connections” pane.
Now, as I scroll down through the list of fields available to our Pivot Table, all of a sudden we see that there’s a brand new table available for us to select from: the Products table.
So if I click to expand that, we now we have all the fields in that table available to add.

Now our ultimate goal here is to have product names on the rows of our Pivot Table, instead of these ugly product IDs. So I'll first remove ProductID from the Rows area, and then simply drag in the “Name” field from the Products table:
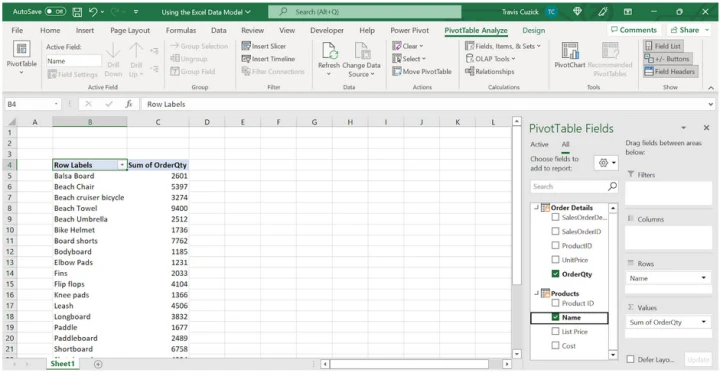
Look at that! Now we have a summarized view of order quantities by product name, based on data in two different tables.
And we didn't even have to resort to some crazy solution using tens of thousands of lookup formulas to smash these data sets together. Instead, we executed a simple drag and drop operation to relate those two tables, and the Excel Data Model did the rest.
It’s worth noting too, that this is the only worksheet in our Excel workbook.
The data in the Order Details and Products datasets is not stored in a conventional workbook; rather, it is being compressed and stored in an incredibly efficient way in the Excel Data Model.

For this reason, Pivot Tables built from the Data Model can handle far more data (up to hundreds of millions of rows, depending on how much horsepower your computer has) than conventional Pivot Tables.
So why use the Excel Data Model?
In short, the Excel Data Model - in tandem with “Power” Pivot Tables - gives us easy-to-use Data Modeling tools, combined with industrial-strength data processing capacity.
- More data sets
- Less hardware constraints
- Relationships and connections
What’s not to love!?
Obviously we've just seen the tip of the iceberg here, and there is so much more we can do. Hopefully you can see the power of this and how it could affect your own Business Intelligence efforts!
P.S.
If you want to learn more about the Excel Data Model tool, Power Query, and other awesome Excel tools, come check out my Business Intelligence with Excel course.
Or, if you want to learn more about Power BI and go from zero experience to being able to do this as a job, check out my Power BI bootcamp.
And finally, if you’re just starting with Excel and some of this above seemed a little complex, but you can see how much value this would have for you, then check out my Excel bootcamp for beginners. I'll walk you through everything you need to know to go from zero experience, to being an absolute data wizard!
More Excel Tutorials
Like this post? Then you'll love my other Excel guides and tutorials:


