


Power Query is an industrial-strength tool for fetching and transforming data, most commonly associated with Microsoft’s flagship Business Intelligence tool, Power BI.
But what many people don’t know is that this very same technology is available in perhaps the most popular data analysis tool in the world: Microsoft Excel.

Using Power Query together with Excel can let us do some seriously cool stuff with our data. Arguably among the most useful, is one of Power Query’s methods for combining multiple datasets into one, called merging, but how do you do this?
Don’t worry!
In this guide I’ll walk you through step-by-step, how to merge large datasets in Excel, in under 5 minutes.
What is Merging?
Merging combines columns from two different datasets, on two different sheets, effectively making the resulting combined dataset “wider” (virtually speaking).
However, for this to work it does require that the individual rows of each respective dataset be associated or tied together in some way; so that we’re able to pull the values and columns from both datasets together in the same row.
For example
The Merge operation is usually accomplished using a field that each dataset has in common - often some kind of ID, but this could also be a particular date, or even a name.

Now if this sounds anything like a VLOOKUP function to you, you're right on. It basically is, albeit a much its a much more powerful one, with far more options for customization.
In fact, the example we’re about to share is going to demonstrate how Merge queries in Power Query can be a superior alternative to VLOOKUP, especially when you want to pull in more than one field from the second dataset.

With that out of the way, let’s get into the walk through example.
How to merge datasets in Excel
So the goal here will be to merge multiple fields from a secondary dataset containing customer-specific information, into a dataset around home sales.
As you might guess, there’s not a huge overlap between those 2 sheets, other than customer information, and that’s what we’re going to use to connect them.
The Customer dataset on the second tab of the example spreadsheet, contains a list of unique customer IDs, along with the customers’ respective names, emails, phone numbers, ages, and incomes.

Then looking at the Home Sales dataset on the first tab, we see a number of fields with information around individual home sales, but only one field pertaining to customers: CustomerID.

So the goal will be to pull in those additional fields about customers, from the Customers dataset into the Home Sales dataset.
Now the key here, literally and figuratively, is the CustomerID column in both datasets. That's how we're going to associate the individual rows in these datasets with each other.
Take for example the first customer listed in the Home Sale dataset, with customer ID 785:

Flipping over to the customer data worksheet on the first row, we find this same customer ID.

So in the final output, our goal is that these values for this particular customer - this name, this email address, this phone number, this age, this income - will be added on the same row, as that same customer ID in the master Home Sale dataset.
Pull the information into Power Query
So now that we understand what we're trying to do here, I’ll go ahead and pull these datasets into Power Query.
And the great thing is, it's easy to load data from the current Excel spreadsheet (as opposed to an external file) into Power Query.
First, you just need to make sure the data is structured as an Excel Table, which both of our datasets already are. If your dataset is not an Excel Table, you can easily convert it to one by selecting any cell in the dataset, and then using the Ctrl + T keyboard shortcut.
Next, just click anywhere within the table, select the “Data” tab on the Excel Ribbon, and over in the “Get and Transform” section hit the “From Table/Range” button.

And just like that, the Home Sales dataset has been loaded to Power Query, and is available for us to transform using all the advanced data manipulation tools Power Query has to offer.
Easy peasy!
So to save this data to Power Query and get back to “regular” Excel, on the Home tab of the Power Query Ribbon, I’ll hit the arrow under “Close & Load”, then select “Close & Load To”:

Then, in the resulting dialog box, I’ll select:
- Select “Only Create Connection”
- Check “Add this data to the Data Model”
- Then click OK

The “Queries & Connections” Pane should then confirm that Power Query has successfully saved a connection to this dataset:

Now I can follow the same steps to get the Customers dataset loaded into Power Query.

And now both datasets are available for us to work with in Power Query!
Merge the datasets
So to actually merge them together – that’s why we’re here after all – I’ll first get us back into Power Query by hitting Get Data >> Launch Power Query Editor, on the Data tab of the Ribbon:

Back in the Power Query Editor, my first step will be to click the “Home_Sales” dataset over here in the Queries Pane, to make sure it’s selected. (Note that Power Query assigned this name by default, based on the name I originally gave the Excel Table the data was sourced from).
This will be the “primary” dataset in the Merge operation - the one that I'm merging the secondary 'Customers' dataset into.

Now, on the Home tab of the Power Query Ribbon, I'll hit the arrow to the right of the “Merge Queries” button, then choose “Merge Queries as New”:

Then here in the Merge dialog box, I’ll need to specify the two datasets we want to merge together, and then tell Power Query how we're going to merge those datasets.

Because I had already selected the Home Sales dataset in the Power Query Editor, that’s what is being previewed in the dialog box.
So now we have to specify the other dataset that we want to merge into the Home Sale dataset. And that's obviously the Customers dataset.
To do that, I'll just click the drop-down box below the preview of the Home Sales dataset, and then choose the Customers dataset:

The next step is to tell Power Query which column these datasets have in common, which is what we're going to use to link them together, row by row.
We already know that we can take the values in all the columns from both datasets for a particular ID, and then combine them on a single line or row in the merged dataset, so obviously that column is CustomerID.
As such, I'll select that for the Home Sales dataset, and also for the Customers dataset:

Using left outer join
Next, we need to specify the type of Join being used. This is the method by which Power Query is going to tie these two datasets together row-by-row.
Now the default kind, which is the most common and which functions the most like a VLOOKUP function, is a Left Outer Join.
If you're familiar with SQL at all, this works exactly like a Left Join in SQL. Basically, the output is going to contain all the rows from the primary dataset (Home Sales in this case), and then any rows from the secondary dataset where there was a match on that CustomerID field.
But if there is a customer ID in the Home Sales dataset that doesn't exist in the Customers dataset, we're just going to see blank, or null values in the columns we're pulling in from the customer data. (More on this in a second).
Then, if we zoom in on the very bottom of the Merge Queries dialog box, we can see that Power Query has already identified that “the selection matches 797 of 799 rows from the first table”:

That means that out of 799 customer ID's in the Home Sales dataset, there were 797 matches found in the Customers dataset. Clearly there are two missing, and in a moment we're going to see how that looks in the output.
But for now I’ll go ahead and click OK...
Clean your data
Scrolling over to the right of our newly merged dataset, we end up with this rather bizarre new column in our newly merged dataset called “Customers”, that has a bunch of values that say “Table”.
So what the heck does this mean?

Well, by default, Power Query isn't going to automatically pull in all columns from the secondary dataset. Instead, it actually lets us cherry pick which ones we want to keep.
So to see that list of columns that's available for us to pull in, all we have to do is click this little button to the right of the column header.

And now we see a list of all the columns from the Customers dataset.
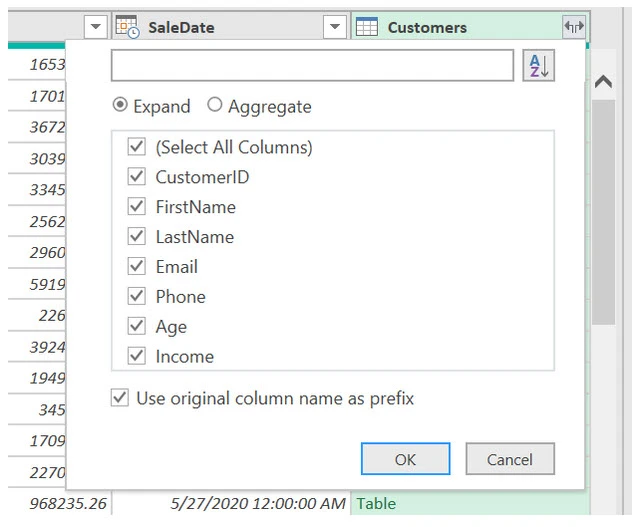
We already have Customer ID in the Home Sales dataset, and we know it's going to be the same as the value from the Order Details dataset on any given row, because that's how we were able to pull in the Customers data to begin with.
So I'll uncheck that to deselect it, but I'll keep the remaining fields, then, click OK.

Now those six columns from the Customers dataset I left selected:
- first name
- last name
- phone number
- age, and
- income
Have been tacked on to the end of the Home Sales dataset. (Note that the column names all have a “Customer.” prefix indicating that they were sourced from the Customers table).
Contrast this with VLOOKUP, which, while it does something similar, requires you to write a column full of VLOOKUP formulas for every single column of data you want to pull in from the secondary dataset.
Gah, no thanks!
But what about those IDs from the Home Sales dataset that were missing from the Customers dataset?
Well, looking at rows 5 and 10 of the output, We see that the word “null” appears in all the columns I pulled in from the Customers dataset.

But we have normal data values in the fields from the Home Sales dataset, in those same rows:

Why is this happening?
This is because of how 'Left Outer Join' handles situations where the value we're using to tie two datasets together exists in the primary dataset, but doesn't exist in the secondary dataset.
Fortunately, there's a solution.
Using Inner Join
There's another way to handle these kinds of mismatches, which is called an Inner Join.
With the Inner Join, if a match isn't found in the secondary dataset, the row won't show up at all. The only difference between what we did here and the Inner Join, is that the rows that have null values from the customer data and actual values from the home sales data wouldn’t be here at all, because there was no match in the Customers dataset.
And just to prove that to you, I'll actually modify the “Source” transformation step over in the Applied Steps pane of the Power Query Editor by selecting it, and then hitting this little gear icon:
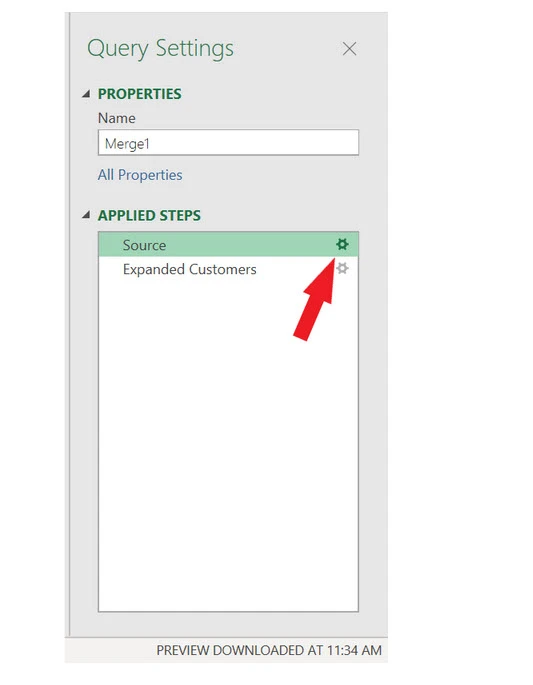
And now instead of choosing a Left Outer Join, I'll opt for an Inner Join, which as Power Query says means “only matching rows”.

Before I move on, take note of the fact that the dataset currently has 799 rows, even though we now know that we only have 797 matches out of these 799 rows:

So now clicking OK in the Merge dialog box, we see that there are now only 797 rows in the resulting dataset:

Then, to see the columns from the Customers dataset expanded, we just need to select the next step in the Applied Steps pane – “Expanded Customers” - which we had already created the last go-around:

Now, scanning the dataset, we see that the rows of data that had null values from the customer data fields (in which customer ID was missing from the Customers dataset), are gone and resolved.

Send merged data back to Excel
So finally, to get this data back into “regular” Excel, I’ll once again hit “Close & Load” >> “Close & Load To” on the Data tab of the Ribbon.

But this time, in the “Import Data” dialog box that follows, I’ll stick with the defaults of “Table” and “New Worksheet”:

Then, after clicking OK, our merged dataset is dropped into a new tab of the Excel workbook.

All done, merged, and loaded back in Excel. Easy!
So now you might be wondering: which one of the join types we just saw should you use, and when?
From my experience, the vast majority of the time the Left Outer Join is what you'll want. This is because in most cases you'll be perfectly content to pull in whatever matches happen to exist from a secondary dataset, but you don't want to lose visibility into any of the rows in the primary dataset.
But if the situation does call for only returning rows where there's a match on both sides of that join, then Inner Join is what you'll want to opt for.
Conclusion
Regardless of which join type you choose, in scenarios where you need to tack some columns from one dataset onto another in the same way that you would with a VLOOKUP, Merge queries can be a terrific option.
And I can't emphasize enough, that while we fetched data from this example spreadsheet into Power Query for one specific use case here, you shouldn't hesitate to employ this “quick import” technique any time you could potentially transform Excel data more efficiently in Power Query than with conventional methods. It's such a powerful tool to play around with.
If you found this guide helpful, and want to learn more about Excel and Data Analysis master, check out my Excel bootcamp.
You'll learn Excel Formulas and Functions, Data Visualization, Pivot Tables, VBA Macros, and much more, so you can even get hired as a Data Analyst this year, with no prior experience!
More Excel Tutorials
Like this post? Then you'll love my other Excel guides and tutorials:
- Beginner’s Guide To The #Spill Error In Excel
- How to Find and Remove Duplicates in Excel
- 8 Excel Project Ideas To Improve Your Skills + Build Your Portfolio
- How To Use Measures In Excel (With Examples!)
- The Excel Data Model: What Is It & How To Use It
- How Developers Can Use Excel to Accelerate Their Career


