


Power BI is Microsoft’s flagship data visualization tool, and has rapidly become a cornerstone in the world of business intelligence.
Designed to transform raw data into meaningful insights, Power BI helps analysts, business users, and decision-makers understand their data better.
However, the process of turning raw data into actionable insights doesn't just happen by magic - it requires meticulous data preparation, and this is where Power Query comes into play.
In this tutorial, I’m going to walk you through what Power Query is, how to use it, how it works with Power BI, and more, so let’s dive in!
Why listen to me?
My name is Travis Cuzick, I’m one of the expert instructors here at Zero To Mastery, and I’ve been architecting and coding data solutions for well over a decade for some of the biggest companies on the Fortune 500.
This means I have extensive experience querying and manipulating literal multi-terabyte enterprise data stores in my work as a Data Solutions Engineer, at major U.S. financial institutions.
As you might guess, I also teach Power BI (with Power Query), so if you have questions about the topics here, want a deep dive, or even want to learn it from scratch, then check out my Business Intelligence with Excel course.

You’ll learn to master Excel's built-in power tools, including Power Query, Power Pivot Tables, Data Modeling, the DAX formula language, and so much more.
No joke, this course will take you from an absolute beginner to being able to get hired in 2024 as a confident and effective Business Intelligence Analyst - so it’s useful for users of any level of experience.
Also, not only do you get access to the course content, but you also have access to me via our private Discord channel, to ask any questions, or get advice from other students and working Data Engineers.
Check it out here or watch the first few videos for free.
With that out of the way, let’s get into this guide.
What is Power Query?
Power Query is an ETL (Extract, Transform, Load) tool that ensures your data is clean, transformed, and ready for analysis.

In the world of Power BI, Power Query works silently behind the scenes, shaping and refining your data to ensure the final visualization is flawless. Better still, it helps to democratize data transformation, making it accessible even to those without a strong technical background.
Think of it as the backstage crew in a theater production. While the actors (visualizations in our case) get all the applause, it’s the backstage team that ensures the show runs smoothly.
So why is Power Query so essential? Well, the answer lies in the nature of raw data.
The role of Power Query within Power BI
When working with Power BI, you'll often encounter datasets and raw data that aren’t analysis-ready.
They usually have missing values, duplicate records, or inconsistent formats. The good news is that Power Query provides a user-friendly interface to help you tackle these common data issues.
You can:
- Connect to various data sources, whether it's databases, Excel/CSV/text files, or online services
- Shape the data by applying transformations such as filtering out unwanted rows or columns, pivoting tables, or adding new calculated columns, and
- Combine multiple datasets, helping to enable richer insights and holistic analysis
Not bad right?
So let’s get into how to use it.
Accessing Power Query from the Power BI Desktop
To start off, you'll need to launch Power Query.
To do this, in Power BI Desktop:
-
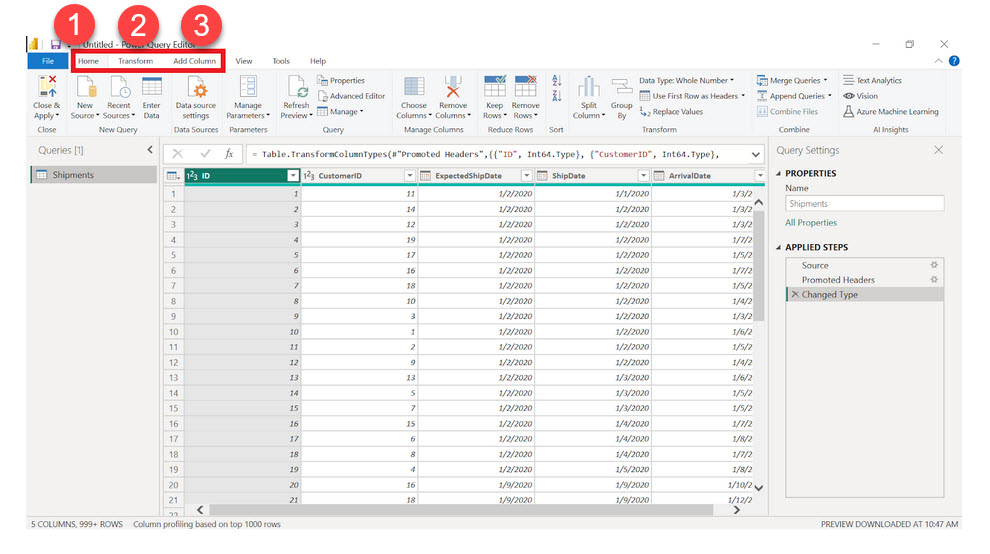
Click on the "Home" tab
-
Find and select the "Get Data" option
-
A window will pop up, listing all the data sources Power Query can connect to

Once you've connected to a data source and imported your data, the Power Query Editor will open, presenting you with a plethora of tools and options.
This is where the real data transformation magic happens, and where you’ll spend a good amount of time shaping your data for analysis.
Alternatively, if you’ve already imported your data and simply want to access Power Query to transform that data in some way, then you can access Power Query directly by hitting the “Transform Data” option on the “Home” tab.

Navigating the Power Query Editor
Navigating the Power Query Editor efficiently is crucial to optimizing your data transformation process.
By familiarizing yourself with its layout and features, you'll not only speed up your workflow but also minimize errors and ensure consistency in your data operations.
The Power Query Editor boasts a ribbon-style interface similar to other Microsoft Office applications.
Here's a breakdown of the tabs you’ll use most of the time:
- Home Tab: This is where you'll find commonly used functions, such as sourcing external data, managing columns, sorting and filtering, and applying basic transformations. Think of it as your go-to place for fundamental data operations
- Transform Tab: A step up from the basic operations, the Transform tab contains tools to modify the structure of your data. Whether it's grouping rows, pivoting tables, or changing data types, this tab offers a more in-depth data transformation toolkit
- Add Column Tab: As the name suggests, here you can add new columns to your dataset. This could be as simple as duplicating an existing column, or as advanced as creating a custom column based on specific calculations or conditions
Understanding the Applied Steps window
Once you’ve imported a dataset into Power Query, you'll also notice a new window called 'Applied Steps' on the right side of the Power Query Editor.
Every action you perform on your data is recorded here as a step, much like with a macro recorder in Excel.
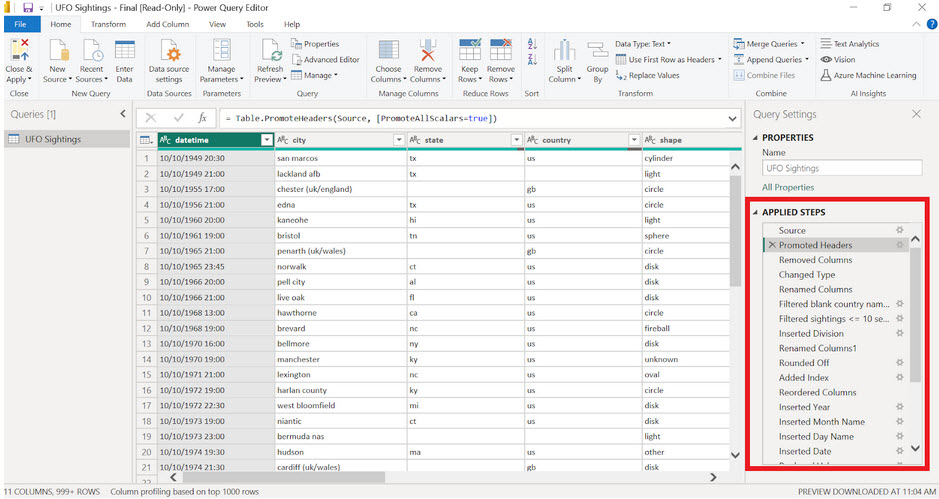
This is incredibly useful for a few reasons:
-
Transparency: It provides a clear record of all transformations applied to the data. This is invaluable when collaborating with others or revisiting a project after some time
-
Editability: Made a mistake? No need to start over. Simply click on a previous step in the Applied Steps pane to revert back to that stage of the transformation. You can also delete or modify specific steps as needed
-
Reusability: The steps you apply can be used as a template for future datasets. This makes repetitive tasks a breeze since you can apply the same series of transformations to new data with just a few clicks
How to import data into Power Query
Of course, in order to transform data, we first need some data to transform!
The good news is that the ability to seamlessly import data from diverse sources is at the core of Power Query’s functionality. Whether your data resides in a cloud-based service, a local database, or an Excel file, Power Query ensures you have the necessary tools to fetch it.
Supported data sources
Power Query offers an extensive list of connectors, making it incredibly versatile with the types of data it can ingest.

Some of the key supported sources include:
- Databases such as SQL Server, Oracle, MySQL, and PostgreSQL
- Excel files, both XLS and XLSX formats
- Cloud-based platforms like Azure SQL Database, Azure Blob Storage, and online services such as SharePoint
- Web sources, including data from web pages and RESTful services
- And many more, from flat files (CSV, TXT) to OData feeds
It’s incredibly easy to import from these 3 major sources also, like so:
Importing from Excel:
- In the Power Query Editor, click on the ‘Home’ tab.
- Choose 'Get Data' and select 'Excel'.
- Browse to your file, select the appropriate sheet or table, and voila, your data is imported!
Importing from an SQL Server:
- Navigate to 'Get Data' and pick 'SQL Server'.
- Enter your server details and database name.
- Choose the tables or write a custom SQL query to fetch specific data. After authentication, your data will be ready for transformation.
Importing from Web sources:
- Under 'Get Data', select 'Web'.
- Input the web URL, and Power Query will attempt to extract tables or relevant data from the page.
3 tips for handling errors during the data import
As always when working with messy, real-world data, importing data isn’t always sunshine and rainbows.
With that in mind, here are some tips to address some of the more common issues you’ll face:
Data format mismatches
Ensure the data type in your source matches what Power Query expects.
For example, if a column is marked as 'Date' in Power Query but has non-date values in the source, it could trigger errors.
Connection issues
When importing from databases or online services, double-check your credentials and connection settings. A small typo or outdated password can prevent data fetching.
Large data volumes
If your dataset is particularly massive, consider fetching only a subset of it initially. This will help you preview the data - and apply transformations - more quickly. Then, once transformations are set, you can opt to load the entire dataset.
Tl;dr
Power Query’s robust functionality for importing data is central to both its value and the overall Power BI workflow.
By efficiently fetching data from a wide variety of sources, Power Query ensures that you have the building blocks in place to carve out your insightful visualizations and dynamic dashboards.
Transforming data with Power Query

Once you have your data imported into Power Query, its metamorphosis from mere rows and columns of data points, to actionable Business Intelligence, can begin.
To do that, we need to start transforming our data, and Power Query is equipped with one of the most extensive suites of data transformation tools on the market, making this process seamless and efficient.
The importance of data transformation
But why is data transformation so pivotal? Because real-world data is MESSY.
It often comes riddled with inconsistencies, missing values, duplicates, and various other issues that make analysts lose sleep at night. To extract meaningful insights from such data, we need to mold it into a cleaner, more structured form.
But the data transformation process doesn’t necessarily stop there; it can also involve enhancing the dataset with calculated columns, merged tables, or aggregate summaries, providing richer, value-added avenues for analysis.
Basic data transformation operations
Here are some of the most fundamental data transformations you’ll be using on a daily basis as a Power BI Developer:
Filtering and Sorting
Filtering eliminates irrelevant rows by applying conditions. For instance, filtering can exclude products with fewer than ten sales or focus on data from the last quarter
While sorting, orders your data based on one or multiple columns, be it in ascending or descending order.
Removing duplicates
We weed out duplicate rows to ensure data integrity. This is especially handy when consolidating data from multiple sources.
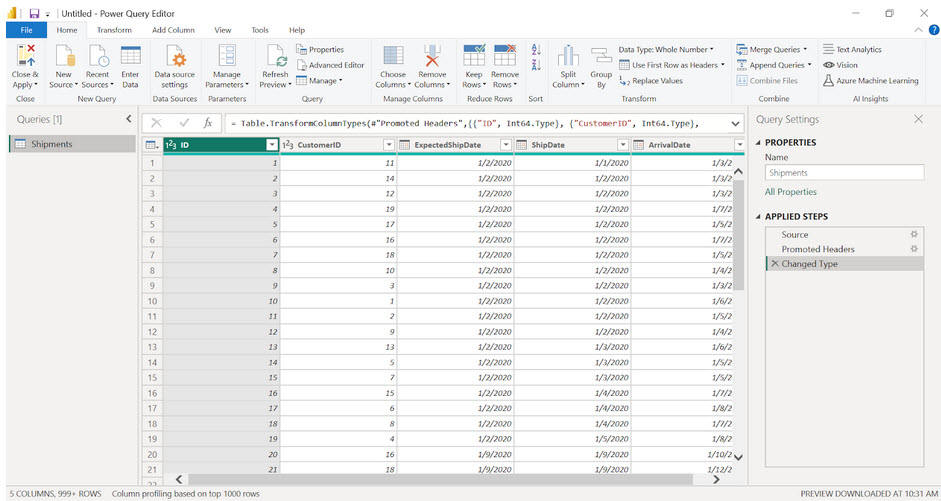
Changing column types
Power Query allows you to easily redefine column data types. For example, you can convert a text column into a date or a number format (assuming the values are compatible with these data types, of course), enabling accurate calculations and visual representations.
Advanced data transformations
Filtering and sorting are great, but Power Query is actually capable of a LOT more.
What like? How about…
Merging queries
This operation combines data from two different tables based on a common column. For instance, you could merge sales data with product details to get a comprehensive sales report.
Appending queries
Appending adds rows from one table to another, which can be particularly useful when you want to concatenate monthly datasets into a yearly overview.
Splitting columns
A column with combined data, such as "First name_Last name", can be instead split into separate columns for first and last names.
Grouping and Summarizing data
Power Query allows you to group data by specific columns, and then perform aggregate calculations like sum, count, average, etc., within those groups.
This is quite similar to a Pivot Table in Excel, or an aggregate query in SQL.

Tl;dr
The tools provided by Power Query for data transformation are expansive.
While these are some of the most commonly used operations, Power Query offers much more, allowing you to handle just about any data transformation challenge you encounter in the wild.
Working with dates and times in Power Query
One of the most common, yet intricate, data types that analysts deal with is temporal data - that is to say, dates and times.
These intricacies arise due to things like different formats, time zones, and the sheer variety of operations that can be performed on date and time data. Fortunately however, Power Query offers a comprehensive suite of tools to work with this data efficiently.
Understanding Date and Time Formats
Before diving into transformations, it's important to understand the distinct formats Power Query classifies such data into:
- Date: Typically represented as MM-DD-YYYYY or YYYY-MM-DD
- Time: Often shown as HH:MM:SS
- DateTime: A combination of the above, representing both date and time
Power Query can also recognize and work with various regional formats, ensuring compatibility regardless of data origin.
Common date and time transformations
Here are some of the most date/time transformations you’ll find yourself performing most frequently.
Extracting information
Power Query gives you the ability to easily extract specific components from a DateTime column. For instance, you can extract just the year, month, day, or even the weekday from a column of DateTime values.
Date arithmetic
You can also perform operations like adding or subtracting days, calculating the difference between two dates, or finding out the number of workdays between two dates.
Time zone adjustments
If you're working with data across different time zones, Power Query enables you to adjust the DateTime values accordingly, ensuring uniformity.
Duration calculations
With Power Query, you can easily determine the duration between time intervals.
This is particularly helpful in scenarios like determining response times, service durations, or lead times.
3 Tips for effective date and time management
Tip 1. Consistency is key
Ensure that all date and time data follow a consistent format; it not only simplifies transformations but also avoids potential errors down the line.
Tip 2. Leverage date hierarchies
Power BI allows you to build hierarchies based on dates.
Once your data is correctly formatted in Power Query, creating these hierarchies in Power BI can offer a richer analysis, allowing for drill-down operations from years to quarters, months, days, and so on.

Tip 3. Beware of time zones
When consolidating data from different regions, always account for time zone differences, as an oversight here can lead to a skewed analysis.
Tl;dr
Dates and times are integral to many datasets, influencing trends, patterns, and business decisions.
With Power Query's robust set of tools, managing this type of data becomes significantly simpler, ensuring your Power BI reports and dashboards are both accurate and insightful.
Power Query integration with Power BI
Power Query is a pretty amazing tool for data ingestion and transformation, but it’s important to remember that it is only one component of the larger Power BI ecosystem.
After all, raw data - even nicely cleaned, shaped, and transformed raw data - is rarely the end product our customers will want us to deliver.
To turn that raw data into actionable insights, we’ll need help from Power BI’s vast data modeling, analytical, and visualization capabilities.
As such, understanding the synergy between Power Query and Power BI is crucial for anyone trying to deliver real Business Intelligence. Let’s take a quick look at how these pieces fit together.
How to export data from Power Query to Power BI
Once you've concluded your data transformation tasks in Power Query, exporting the results of your work into Power BI is a breeze.
Here’s how it's typically done:
Loading data
After all of your transformations are applied in the Power Query Editor, click on 'Close & Apply'. This action loads the data into Power BI, making it available for visualization.

Refreshing data
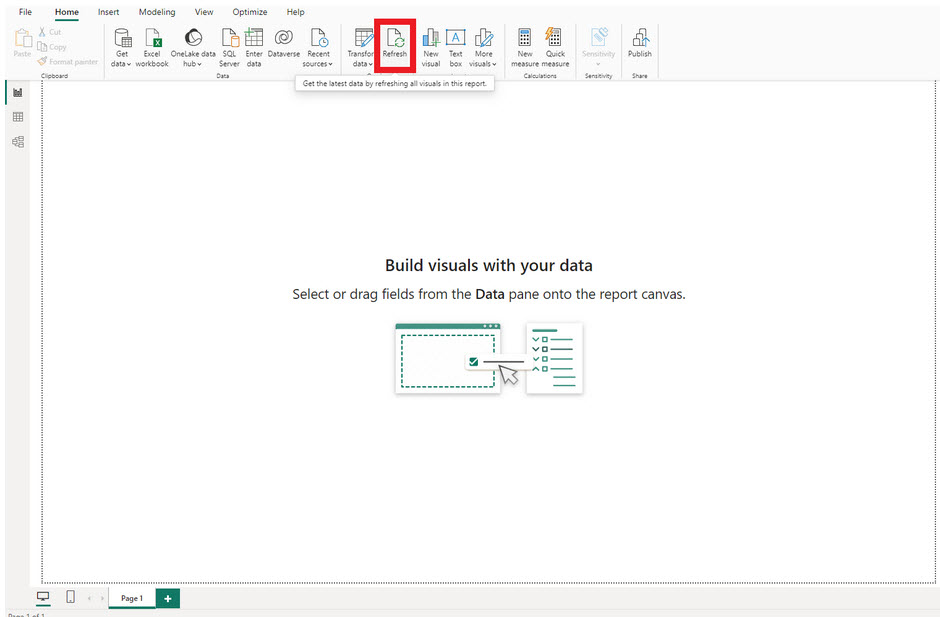
As your source data changes or updates, you can easily refresh your dataset in Power BI.
If the transformations in Power Query remain relevant, they’ll be applied automatically to the updated data.
Enhanced modeling with Power BI
With squeaky-clean, transformed data delivered fresh from Power Query, building a data model in Power BI becomes straightforward:
Relationships
The first step is to define relationships between different tables, allowing for cross-filtering and richer insights.

DAX formulas
The Data Analysis Expressions (DAX) language in Power BI allows you to create custom calculations. And with your logically structured data from Power Query, DAX can be employed far more effectively.

3 Benefits of using Power Query with Power BI
There are MANY advantages to maximally leveraging Power Query as part of your overall Power BI workflow, but here are some of the biggest ones:
- Consistency and Accuracy: Pre-processing and cleansing data with Power Query ensures your Power BI reports are free(er!) from inaccuracies and discrepancies
- Efficiency: The transformations and operations you define in Power Query can be saved and reused, facilitating quicker data preparation for recurring reports
- Flexibility: Need to tweak your data? Jump back to Power Query, make the changes, and then seamlessly update your Power BI report
The integration between Power Query and Power BI is more than just about data transformation and visualization. It's about optimizing the entire process of data analysis, from source to insight.
Leveraging both tools in tandem not only simplifies the data analysis and visualization process, but also ensures that your insights are grounded in accurate and structured data.
Now, go clean up your own data!
Data in its raw form, no matter how vast or granular, carries potential but is not immediately insightful. It's the process of refining, transforming, and molding this data that unlocks its true value, and Power Query is that crucial bridge between raw data and actionable insights.
It ensures that before any analysis or visualization begins, the data is in its best possible state.
That’s why, in the age of data-driven decision-making, tools like Power Query are not just conveniences; they're necessities. They ensure that organizations, big or small, can derive meaningful, accurate, and timely insights from their data.
As you continue your journey in data analytics, remember that the tool is only as effective as the person wielding it. And with the knowledge gained here - combined with a mindset of continuous improvement - you are well on your way to becoming a Power Query maestro.
P.S.
Again, if you have questions about the features here, want a deep dive into Power Query, or even want to learn how to use it from scratch, then check out my Business Intelligence with Excel course.
You’ll learn to master Excel's built-in power tools, including Power Query, Power Pivot Tables, Data Modeling, the DAX formula language, and so much more.
Also, not only do you get access to the course content, but you also have access to me via our private Discord channel, to ask any questions, or get advice from other students and working Data Engineers.


