In This Guide:
Are you looking for a new time-series forecasting tool, found LinkedIn Greykite, and now want to know how it works?
Well, good news! In this guide, I’ll break down how LinkedIn Greykite works, how you can use it, as well as compare it to its common alternative, Facebook Prophet.
This way, you can then decide which tool is best for you and your needs.
So grab a coffee and let’s dive in.
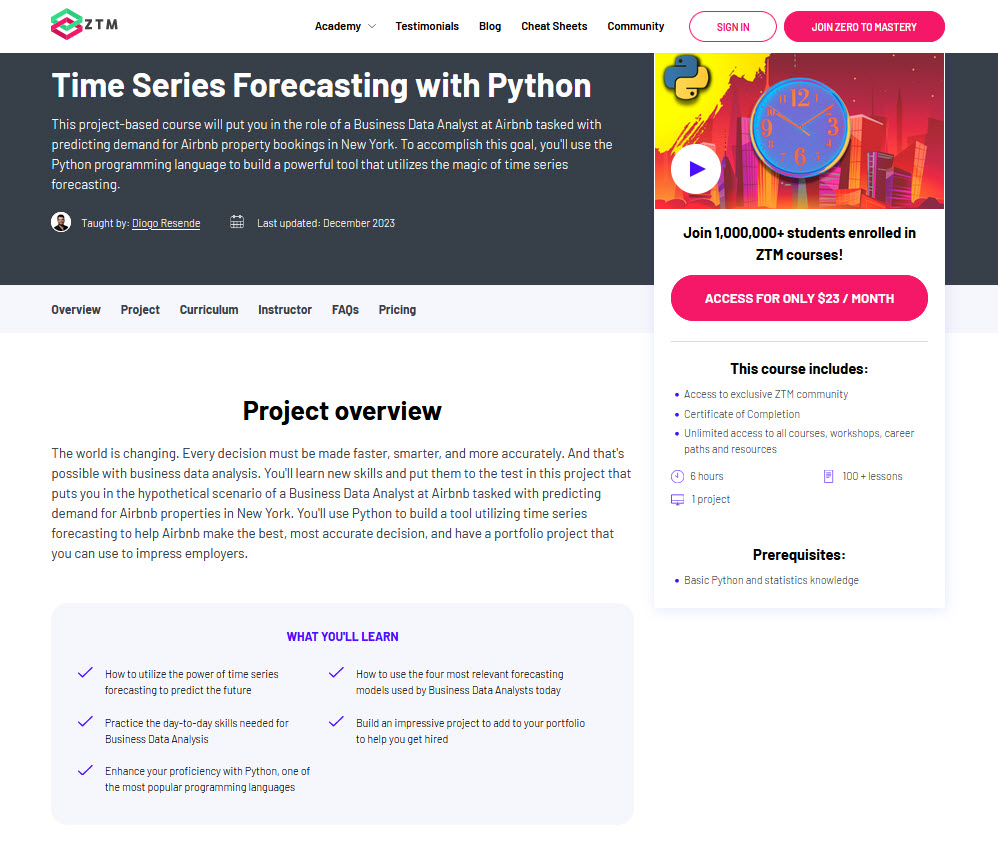
Sidenote: If you want a deep dive into Time Series Forecasting with Python, then be sure to check out my complete course on this topic.
This project-based course will put you in the role of a Business Data Analyst at Airbnb tasked with predicting demand for Airbnb property bookings in New York. (Oh! I'm forecasting here).
To accomplish this goal, you'll use the Python programming language along with SARIMAX, Facebook Prophet, LinkedIn Greykite, and recurrent neural networks to build a powerful tool that utilizes the magic of time series forecasting.
Better still, I’ll walk you through it all, step-by-step! Check it out here or watch the first videos for free.
Anyway, with that out of the way, let’s get into this guide…
How does LinkedIn Greykite work?
LinkedIn Greykite is a versatile, scalable, and customizable Python library designed for tackling time series problems with style.
Its secret sauce is the Silverkite algorithm - a highly configurable and interpretable forecasting method, that works together with the Forecasting Grid to enable seamless time series forecasting.
How?
Silverkite uncovers hidden trends and seasonal patterns, while the Forecasting Grid helps to fine-tune your models, scrutinizing countless hyperparameters, and ensuring that Greykite's predictions are precise.
The Forecasting Grid is brilliant as it embeds Parameter Tuning in the model building.
Why is this a big deal?
Well, while other Time Series Forecasting Models require that you build a process for tuning the parameters, Greykite makes it part of the modeling process, simplifying it.
It gets better though, as the Greykite forecast library also allows you to connect both Prophet and SARIMAX, if you want to.
But, what truly sets Greykite apart from the competition is its uncanny ability to navigate the missing data points and outliers - ensuring the show goes on without missing a beat.
Why does this matter?
Because data points and outliers are integral parts of the time series forecasting world and Greykite makes it easy for everyone, including beginners, to deal with it
How Silverkite works
Silverkite's genius lies in its harmonious blend of Data Inputs and Function Inputs.
Data Inputs are the foundation of our forecasting, and include features such as:
- The time series we wish to predict
- The influential regressors
- And events and holidays
Much like Facebook's Prophet, Silverkite incorporates holidays, whether they're provided by the library or crafted by hand.

The Function Inputs comprise the key Time Series components.
Everything from:
- Growth terms that represent the trend
- Various types of seasonality that capture data cycles
- Changepoints such as dramatic breaks or shifts in the Trend or Growth Terms, and
- Autoregression (similar to what you might see in SARIMAX), and
- Lagged regressors
I’ll cover regressors more later on, but for now, the basic thing to understand is that the impact of regressors may occur on different days than their execution. And by enabling lagged regressors, we can ensure that such delayed effects are taken into account and not missed.
Silverkite's true magic, however, lies in its ability to seamlessly blend elements of Facebook Prophet, SARIMAX, and a diverse array of Machine Learning models, allowing for an accurate forecast, and visualized components.
Silverkite vs Prophet

Both Prophet and Greykite are designed for the same tasks, however, they each have certain strengths and weaknesses.
The best way to compare them is to look at:
- Their speed
- Forecast accuracy with default and customized parameters
- Ease of use
- Autoregressive term, and finally,
- Their underlying algorithms that fit the data and parameters

So let’s break them down…
Speed
While speed may not be paramount for all forecasters, Silverkite blazes past Prophet with ease.
Forecast accuracy
When it comes to forecast accuracy, both algorithms deliver commendable performances with their default parameters. However, Silverkite shines even brighter when customized, demonstrating superior accuracy compared to Prophet.
Also, while LinkedIn deemed Prophet's accuracy as limited, I believe it still deserves a standing ovation.
Ease of use
As for ease of use, there is some debate. Silverkite may be a more versatile performer, but Prophet's simplicity and user-friendliness make it a crowd favorite, particularly among beginners.
Auto-regression
Silverkite is the clear winner here, simply because Prophet lacks this feature.
Algorithms
Lastly, we turn our attention to the algorithms that fit the data and parameters.
Prophet follows a Bayesian logic, while Silverkite offers a smorgasbord of options, including Ridge and Gradient Boosting.
This versatility allows for fine-tuning and customization, further elevating Silverkite's allure.
So which is best?
Silverkite emerges victorious, but let's not dismiss the charm and versatility of Prophet.
For those seeking a simple and user-friendly way to study time series, Prophet still remains a worthy contender, but Silverkite does pull ahead across multiple areas.
How to set up and use LinkedIn Greykite
In this subsection, I'll guide you through setting up LinkedIn Greykite and provide the Python code to get your forecasting party started.
Before using Greykite, you need to install it with the following code:
# Install via pip:
pip install greykite
After installing Greykite, go ahead and import the required modules and functions, alongside the common ones:
#libraries
import numpy as np
import pandas as pd
from greykite.framework.templates.autogen.forecast_config import *
from greykite.framework.templates.forecaster import Forecaster
from greykite.framework.templates.model_templates import ModelTemplateEnum
from greykite.common.features.timeseries_features import *
from greykite.common.evaluation import EvaluationMetricEnum
from greykite.framework.utils.result_summary import summarize_grid_search_results
from plotly.offline import iplot
To make this tutorial a complete guide, let’s generate a dummy data set on a daily level.
In this example, I will create a dataset containing one target variable, "sales," and two regressors, "price" and "promotion."
# Import libraries
import random
from datetime import datetime, timedelta

# Function to generate random dates
def generate_dates(start_date, end_date):
    date_range = (end_date - start_date).days
    return [start_date + timedelta(days=i) for i in range(date_range + 1)]

start_date = datetime(2021, 1, 1)
end_date = datetime(2022, 12, 31)

dates = generate_dates(start_date, end_date)
n = len(dates)

# Generating random sales data (target variable)
np.random.seed(42)
sales = np.random.randint(50, 150, size=n)

# Generating random price data (regressor 1)
price = np.random.uniform(10, 50, size=n)

# Generating random promotion data (regressor 2)
promotion = [random.choice([0, 1]) for _ in range(n)]

# Creating the DataFrame
data = {
    "Date": dates,
    "y": sales,
    "price": price,
    "promotion": promotion,
}

df = pd.DataFrame(data)
print(df.head())
Finally, I will specify the metadata to be added to the model.
Because the goal here is to share with Silverkite the time granularity (daily, weekly, etc…) and names of the time series and date variables, let’s add them:
#Specifying Time Series names
metadata = MetadataParam(time_col = "Date",
                         value_col = "y",
                         freq = "D",
                         train_end_date = pd.to_datetime("2022-11-30"))
metadata
Note: The
train_end_datemust be added before the end of the time series, since the period until the end of the time series should be the future forecasting period.
Silverkite Model Components
Let's take a look at the seven key components of Silverkite's forecasting model.
The main components are:
- Growth terms
- Seasonalities
- Holidays and events
- Changepoints
- Regressors
- Lagged regressors, and
- Autoregression
It does make it a little more complex, but this complexity is allows us to more accurately measure our Time Series.

Let’s dive a little deeper into each of these.
Growth terms
Growth terms come in three variations:
- Linear
- Quadratic, and
- Square root.
Each reflects the shape of the trend curve, and we'll visualize and fine-tune these trends in the following section.

- Linear Growth paints a picture of a straight line, suggesting a consistent increase in the trend
- Quadratic Growth, on the other hand, shows an accelerating trend over time, resulting in a U-shaped curve
- Lastly, Square Root Growth reveals a saturated growth pattern as time progresses
Keep in mind that external factors like pandemics or macroeconomic sentiment can also alter the trend's shape, so it's wise to fine-tune this component regularly.
Fortunately, tuning in Greykite is something that is semi-automated, and you can start by specifying the alternatives inside a dictionary:
#growth terms possibilities
growth = dict(growth_term = ["linear", "quadratic", "sqrt"])
growth
Seasonality
Hourly data and daily data can still make use of yearly, quarterly, monthly, and weekly seasonalities.
How does this compare to other models?
- Well, when it comes to seasonality in SARIMAX, it allowed us to pick just one seasonality, but we could choose its frequency
- In Facebook Prophet, we had three seasonalities - daily, weekly, and yearly - and we could have all of them, assuming we had hourly data
However with Silverkite, we can have up to 5 pre-set seasonalities.
Since it can start to be a bit confusing, let’s have a look, starting with the daily seasonalities.

For example
Imagine we want to understand the seasonal cycles of Netflix subscriptions.
Looking at the daily seasonality, we could see lower subscriptions in the early hours of the day, then growing and peeking in the evening.

Looking at the weekly cycles, from Monday to Sunday, we would see a high in the week, and a bottom demand on Friday and Saturday, since people are more prone to go out.
Then it picks back up on Sunday, like so:

For Monthly seasonality, from day 1 to day 30 or 31, depending on the month, we could see a higher propensity to subscribe at the start of the month when the disposable income is highest.
Then it would slowly decrease throughout the month.

I don’t really have a story for quarterly seasonality, but it reflects the seasonality intra-quarter. So if there is a pattern across the quarters, then this parameter would quantify it.
An example could be this curve, where the second month of each quarter has a higher demand.

The last possibility would be yearly, which is the monthly demand.
I would posit that during the colder months, and, of course, I am just considering the people in the northern hemisphere now, the demand would be highest. Inversely, it would be lowest during the warmer months.
The easiest way to figure this out though is to set Silverkite on auto-pilot and then it will detect which type of seasonalities exist in the time series on its own!
# seasonalities
seasonality = dict(yearly_seasonality = "auto",
                   quarterly_seasonality = "auto",
                   monthly_seasonality = "auto",
                   weekly_seasonality = "auto",
                   daily_seasonality = "auto")
seasonality
Holidays
One key aspect of many real-world time series datasets is the impact of holidays and special events.
Silverkite recognizes the importance of incorporating these events into the forecasting model and provides a way to include holiday effects easily, and for most countries, the holidays are already included.
Here is an example of how to check if a country is included and to print the holidays for it. (Looking for the US).
#checking which countries are available and their holidays
get_available_holiday_lookup_countries(["US"])
get_available_holidays_across_countries(countries = ["US"],
                                        year_start = 2015,
                                        year_end = 2021)
Of course, holidays can often impact the surrounding days as well.
For example
When it comes to Valentine’s day, the majority of the demand for the event will happen before the day itself (and even after for the lovebirds with a faulty time awareness).
Therefore, it is important that time series forecasting models allow for this pre and post-inclusion.
To specify the holidays, including how many pre and post-days should be included in the model, run the following code:
#Specifying events
events = dict( holiday_lookup_countries = ["US"],
              holiday_pre_num_days = 2,
              holiday_post_num_days = 2)
events
Changepoints
In many time series datasets, structural changes or significant shifts can occur due to various factors. These points in time, known as changepoints, can have a substantial impact on the forecasting model's performance.
Fortunately, Silverkite offers an efficient and automated way to incorporate changepoints into the forecasting process.
#Changepoints -> reflects the changes in the trend
changepoints = dict(changepoints_dict = dict(method = "auto"))
Easy, right?
Regressors
Regressors play a crucial role in time series forecasting, as they can significantly enhance the accuracy and interpretability of the resulting models.
These external variables help capture the effects of various factors that influence the target variable, which might otherwise be difficult to model using time series data alone.
How?
Well, by incorporating relevant regressors into your forecasting model, you can account for additional information that directly or indirectly impacts the target variable's behavior.
Some of the benefits and relevance of using regressors in time series forecasting include:
1. Improved Forecast Accuracy
Regressors can help explain the target variable's variance, allowing the model to make more accurate predictions.
This is particularly relevant when the target variable is influenced by multiple external factors that follow independent patterns or when the time series data exhibits complex or irregular seasonality.
2. Increased Model Interpretability
Including regressors in your forecasting model can make it more interpretable by revealing the relationships between the target variable and the external factors.
This can help you gain valuable insights into the underlying dynamics of your data and understand how different factors contribute to the target variable's behavior.
3. Ability to Forecast in the Presence of Intervention
When a time series is affected by external interventions (e.g., marketing campaigns, policy changes, or economic shocks), incorporating regressors can help account for these effects and improve the model's ability to predict future observations in the presence of such interventions.
“We ran an ad and got a boost in sales. Let’s run another ad” etc.
4. Capturing Nonlinear Relationships
Regressors can also help capture nonlinear relationships between the target variable and external factors, allowing the model to better adapt to changes in the data.
To include regressors in the Silverkite model, you specify them inside a dictionary like this:
#Regressors
regressors = dict(regressor_cols = ["Price", "Promotion"])
regressors
Lagged Regressors
Lagged Regressors are a super cool feature of Silverkite, which allows us to include a parameter set for lagged values. Additionally, it also offers a fully automatic way of modeling lagged regressors based on the forecasting horizon we have.
But what are they and how do they work?
For example
Imagine we have the marketing investment variable, represented by this arrow, with each ball being a data point. At the same time, we also have the Y, which has observations in parallel.
The usual way regressors are applied is that the cause and effect happen on the same day.

However, we know that it may not always be the case.
For example
If we have an ad today, the conversion may only be on the day after, or two days, or whatever the number of periods, typically referred to as a ‘conversion window’.

With lagged regressors, that relationship is then applied and studied for all future observations, so you can more accurately measure that delayed impact.

Pretty cool eh?
Silverkite even has an automated way of setting how many periods should be assessed for the impact.
#Lagged Regressors
lagged_regressors = dict(lagged_regressor_dict = {"Price": "auto",
                                                  "Promotion": "auto"})
Better still, Silverkite has an automated feature to set the lagged values based on the forecasting horizon, similar to the auto-regressive term.
Autoregression
Autoregression is a critical aspect of time series forecasting, as it allows models to capture dependencies between past and future values of a target variable.
This technique is especially relevant when the target variable exhibits patterns or trends that are driven by its own historical values.
Why use it?
By incorporating autoregression into your forecasting model, you can leverage the information within the time series data itself to make more accurate and reliable predictions.
Some of the benefits and relevance of using autoregression in time series forecasting include:
1. Capturing Temporal Dependencies
This helps ensure that the model can account for the inherent structure in the time series data, making it more likely to generate accurate forecasts.
2. Simplicity and Interpretability
This makes it easier to understand how the model makes predictions and how the past values of the time series influence future forecasts.
Handy!
Now, from a modeling perspective, the question is often "How long in the past should we look for, to get valuable information?”
It doesn’t matter because Silverkite has an automated way of dealing with this, thanks to its autoregression feature!
#autoregression -> dependent on the forecasting horizon
autoregression = dict(autoreg_dict = "auto")
Fitting Algorithms in Silverkite
One of the most exciting features of Silverkite is the multiple fitting algorithm options.

With Silverkite, we have the option to use the growth terms or trend, the multiple seasonalities, holidays and events, changepoints, regressors and lagged regressors, and, finally, the auto-regression.
Silverkite successfully allows not only statistical models but also advanced Machine Learning models, so that we can combine multiple algorithms.
Let’s see our possibilities, which are 9 in total.

There are some that you may already know, such as Linear Regression.
Then we have Elastic Net, Ridge, Lasso, Stochastic Gradient Descent, Lars, Lasso Lars, Random Forest, and Gradient Boosting.
To go into all of them would be a separate guide on its own, but for now, let me give you some remarks on some of them:
- The Linear Regression is poor at dealing with collinearity
- The stochastic gradient descent shows unstable results
- Lars is sensitive towards outliers and noise
- Also, the Random Forest and Gradient Boosting don’t model well the trend
So, we have a lot of options, but how do we fit them?
Well, given the plurality of Machine Learning models, I will often take up to 4 possibilities, like so:
#Fitting algorithms
custom = dict(fit_algorithm_dict = [dict(fit_algorithm = "linear"),
                                    dict(fit_algorithm = "ridge"),
                                    dict(fit_algorithm = "rf"),
                                    dict(fit_algorithm = "gradient_boosting")])
Build the Silverkite Model
Now that all components are done, you put them all together with the ModelComponentsParam function.
#Build the model
model_components = ModelComponentsParam(growth = growth,
                                        seasonality = seasonality,
                                        events = events,
                                        changepoints = changepoints,
                                        regressors = regressors,
                                        lagged_regressors = lagged_regressors,
                                        autoregression = autoregression,
                                        custom = custom)
Next, you can configure the cross-validation.
I usually use 180-360 days, depending on how long I am willing to wait. More is usually better, as a longer time frame can allow for more accurate data 🙂.
#Cross-validation
evaluation_period = EvaluationPeriodParam(cv_min_train_periods= df.shape[0] - 180,
                                          cv_expanding_window = True)
Another important thing is the KPI to measure error.
Personally, I like to stick with the Root Squared Mean Error and it is set up like this:
#Evaluation metric
evaluation_metric = EvaluationMetricParam(
    cv_selection_metric = EvaluationMetricEnum.RootMeanSquaredError.name)
Then we put everything together with the desired forecasting horizon.
The usual choice is to just pick the same horizon that you will use the model for.
For example
If you will use it for the next 31 days, pick 31. If it is 60 days, then use 60.
#Configuration
config = ForecastConfig(model_template = ModelTemplateEnum.SILVERKITE.name,
                        forecast_horizon = 31,
                        metadata_param = metadata,
                        model_components_param = model_components,
                        evaluation_period_param=evaluation_period,
                        evaluation_metric_param = evaluation_metric)
Finally, we use the Forecaster function to combine everything we have done so far and apply it to the data set, like so:
#Forecasting
forecaster = Forecaster()
result = forecaster.run_forecast_config(df = df,
                                        config = config)
Now, it is all about checking the results.
First off, I like to start with the cross-validation.
#CV results
cv_results = summarize_grid_search_results(
    grid_search = result.grid_search,
    decimals = 1,
    score_func = EvaluationMetricEnum.RootMeanSquaredError.name)
However, when you use the code above, you will get something extremely overwhelming.
Therefore, I like to use the following code snippet to just get the KPIs I am looking for. In this case, I’m looking for the error (RMSE) for each combination of parameters tested.
#Set the CV results index
cv_results["params"] = cv_results["params"].astype(str)
cv_results.set_index("params", drop = True, inplace = True)

#Looking at the best results
cv_results[["rank_test_RMSE", "mean_test_RMSE",
            "param_estimator__fit_algorithm_dict",
            "Param_estimator__growth_term"]]
To isolate the combination with the best parameters, you look for the one with the lowest RMSE, like so:
best_params = cv_results[cv_results.rank_test_RMSE == 1][["mean_test_RMSE",
                                            "param_estimator__fit_algorithm_dict",
                                            "param_estimator__growth_term"]].transpose()
best_params
And we are done! You now know how to fine-tune a Silverkite model.
Pros and Cons of Silverkite

Pros:
I think the LinkedIn team ticked many boxes with their library.
- First, as we were able to see, it can deliver great accuracy, which is the most important thing regarding forecasting
- Additionally, they have so many parameters that have an auto mode. Therefore, the parameter tuning does not take that long, which is also a bonus for me
- Moreover, I think they did a great job going the extra mile on the seasonality topics, given that there are 5 types of seasonalities available.
- Finally, the option of choosing among many different algorithms is perfect since we never know the optimal solution for our problem from the start.
Cons:
- On the negative side, it is not so beginner-friendly, given the complexity of options but also the coding, since we create a lot of dictionaries that make it difficult to debug
- Also, the complexity is exponential when we try to customize the problem beyond what we did.
Will you use LinkedIn Greykite for your forecasting needs?
Hopefully, this guide helped to answer any common questions you had about Greykite and how / why you should use it.
It’s an incredibly powerful tool, with a little steeper learning curve than Prophet, but it makes up for this with its accuracy.
And remember: If you want a deep dive into Time Series Forecasting with Python, using LinkedIn Greykite, Facebook Prophet, SARIMAX and more, then be sure to check out my complete course on this topic.
It’s project based so you’ll pick it up and apply what you learn as you go.
Also, the projects are similar to what you’ll use day to day as a Data Analyst at Airbnb. You'll use the Python programming language to build a powerful tool that utilizes the magic of time series forecasting, and I’ll walk you through it all, step-by-step.


